How the Ukraine-Russia war rattled global financial markets
2022.08.24 03:30

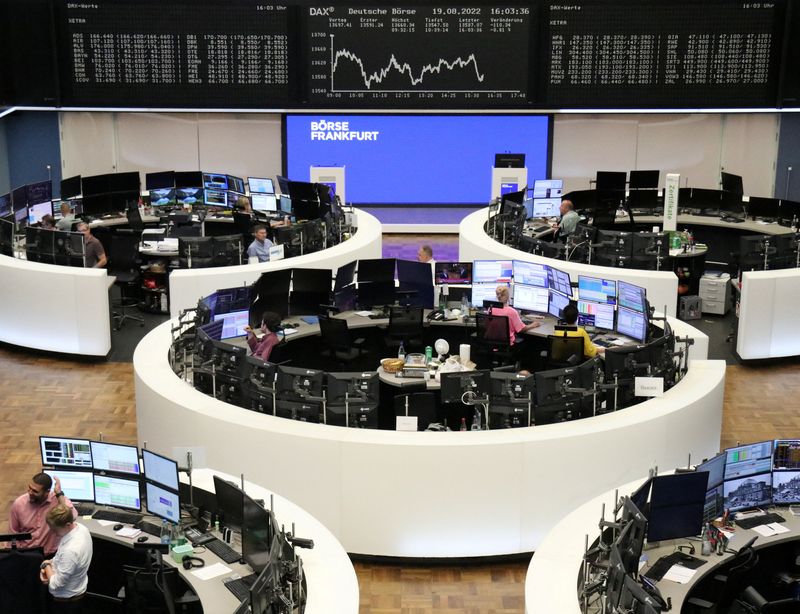
FILE PHOTO: The German share price index DAX graph is pictured at the stock exchange in Frankfurt, Germany, August 19, 2022. REUTERS/Staff
By Marc Jones
LONDON (Reuters) – Over six months since Russia invaded Ukraine in what Moscow calls its “special military operation” thousands have been killed, millions made homeless and the world has seen the worst East-West tensions since the Cold War.
It has also thrown global financial markets into severe turmoil as the charts below show.
1/RECESSION FEARS
Recessions now look almost certain in Europe as prices of gas, critical for households and industry, more than trebled since June alone on fears Russia will cut off its supplies, possibly leading to energy rationing in some economies.
Yet the European Central Bank, the Bank of England and other central banks are determined to crush the inflation spiralling energy costs are fuelling, even if higher interest rates are bound to further squeeze households and companies struggling with rising costs.
GRAPHIC – Recession bound?
https://graphics.reuters.com/UKRAINECRISIS-SIXMONTHS/egvbkdgeapq/chart.png
2/GROWING PAINS
Agricultural markets whipsawed after the invasion but have proved remarkably flexible since. Wheat and corn – Ukraine and Russia’s key exports – have swooped right back down after an initial price surge, while Moscow’s main source of income, oil, is now fetching less than when the invasion started.
GRAPHIC – Six months of the Ukraine war
https://fingfx.thomsonreuters.com/gfx/mkt/mypmneyobvr/Pasted%20image%201660815413565.png
3/INFLATION PALPITATIONS
The surge in energy and food prices, in combination with post-pandemic supply chain strains, have driven inflation rates around the world to levels last seen in the 1970s. This has had widespread ramifications for bond markets especially where borrowing costs have ballooned and default worries deepened.
GRAPHIC – Inflation palpitations
https://fingfx.thomsonreuters.com/gfx/mkt/lgvdwybdwpo/Pasted%20image%201661272612465.png
4/EURO TRASHED
The euro is down more than 12% so far this year, more than over any comparable period in the years since its introduction in 1999, reflecting the view that further cuts in supplies of Russian gas will hit particularly hard major euro zone economies that depend on it, such as Germany and Italy.
GRAPHIC – Euro trashed
https://fingfx.thomsonreuters.com/gfx/mkt/mypmnerqqvr/Pasted%20image%201661248285941.png
5/OUT OF GAS
Russian gas flows through major pipelines to Europe have fallen around 75% since the start of the year leading to accusations by top European politicians that Moscow is weaponising its natural resources.
Russia has denied the cuts are premeditated, but the fact they are happening and that the EU relied on Russia for 40% of its gas before the invasion, has propelled its price to 270 euros/MWh from under 50 euros/MWh this time last year.
GRAPHIC – Russia pipeline gas supplies to Europe
https://graphics.reuters.com/UKRAINE-CRSIS/RUSSIA/movangrozpa/chart.png
GRAPHIC – UK gas price futures
https://fingfx.thomsonreuters.com/gfx/mkt/znpnergmavl/Pasted%20image%201661255390184.png
6/UNDERPERFORMERS
Germany’s and Italy’s reliance on Russia made their stock markets among the world’s worst performers. Those close to the fighting, including Poland and Hungary, also saw their
equities and currencies pummelled. Bonds of countries with high gas or wheat import bills, took a beating too.
GRAPHIC – CEE currencies crushed by crisis
https://fingfx.thomsonreuters.com/gfx/mkt/dwpkrwmwevm/Pasted%20image%201661269761912.png
Graphic – German, Italian and CEE indexes underperform
https://fingfx.thomsonreuters.com/gfx/mkt/byvrjydzqve/Pasted%20image%201661177882724.png
7/CHEMICALS AND CAR PARTS
Shares of chemical companies have suffered some of the biggest declines since the invasion, since natural gas plays a key role in their manufacturing process. Car parts makers have also been hit hard, partly because Russia was a major market for firms such as VW and Mercedes and partly because Ukraine and Russia have also been suppliers.
“European Chemical companies have had a bit of a torrid time,” said Mirabaud equity analyst William Mileham. “There have been production stoppages, and discussions around potential gas rationing have hit their share prices hard recently.”
GRAPHIC – Chemicals and car parts makers hammered by Russia Ukraine war
https://fingfx.thomsonreuters.com/gfx/mkt/lbpgnaxxgvq/Pasted%20image%201661262372473.png
8/VOLATILE TIMES
Volatility gauges for markets from stocks and bonds to oil and the euro-dollar exchange rate soared in the wake of the Feb. 24 invasion before a bumpy ride down later on. But they spiked again this month as the energy and recession worries have mounted again.
Graphic – Volatility gauges erupt
https://fingfx.thomsonreuters.com/gfx/mkt/zgvomgdxgvd/Pasted%20image%201661266750960.png
9/FALLING RATINGS
The war has been mentioned as a factor in nearly 250 S&P Global (NYSE:SPGI) credit rating downgrades or outlook cuts since late February. Russian borrowers accounted for over half of them, but rising energy and borrowing costs mean the impact will continue to spread wider.
Ukraine has defaulted as the war has wrecked its economy and finances. Sanctions have also pushed Russia into its first sovereign debt default in decades and left over $25 billion of the country’s corporate debt unpaid.
“Russian corporates have shown a very strong willingness to keep paying foreign creditors, even with the obstacles that sanctions have placed upon them,” Jeff Grills at Aegon (NYSE:AEG) Asset Management added, though.
GRAPHIC – Credit rating moves linked to Russia-Ukraine war fallout
https://fingfx.thomsonreuters.com/gfx/mkt/zgpomgddqpd/Pasted%20image%201661263507575.png
10/CORPORATE EXODUS
Big brands from Nike (NYSE:NKE) and Coca-Cola (NYSE:KO) to IKEA and Apple (NASDAQ:AAPL) are among over 1,000 global firms that have exited Russia or made public plans to scale back their activities there, according to a list https://som.yale.edu/story/2022/over-1000-companies-have-curtailed-operations-russia-some-remain?company=shell&country= compiled by researchers at Yale.
It adds up to billions of dollars worth of assets. But others have either stayed or maintained https://moralratingagency.org what they have described as essential or unsellable parts of their businesses in Russia.
“We have never seen anything of this magnitude in economic history,” said Jeffrey Sonnenfeld, Senior Associate Dean for Leadership Studies at Yale, who has led the project.
GRAPHIC – Companies pulling out of Russia
https://fingfx.thomsonreuters.com/gfx/mkt/zdpxozebgvx/Pasted%20image%201661265033239.png


