History shows strong 2023 could keep US stocks on path for 2024 gains
2023.12.29 16:00

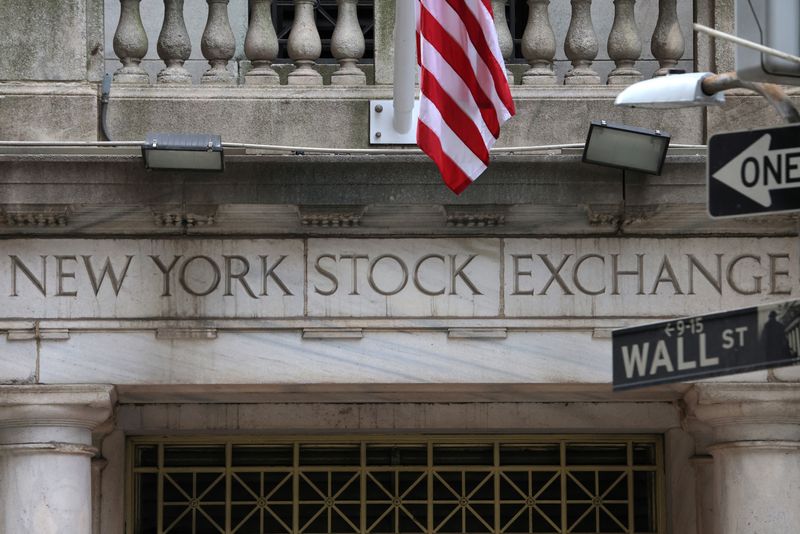
© Reuters. FILE PHOTO: Signage is seen at the New York Stock Exchange (NYSE) in Manhattan, New York City, U.S., November 11, 2022. REUTERS/Andrew Kelly/File Photo
By Lewis Krauskopf
NEW YORK (Reuters) – The U.S. stock market’s hefty gains in 2023 could provide a lift for equities next year, if history is any guide.
Hours before the closing bell in the last session of the year, the was set to finish with a 24% annual gain. The benchmark index also stood near its first record closing high in about two years.
Market strategists who track historical trends say that such a strong annual performance for stocks has often carried over into the following year, a phenomenon they attribute to factors including momentum and solid fundamentals.
“What we continue to come back to is solid gains for next year,” said Adam Turnquist, chief technical strategist at LPL Financial (NASDAQ:). “Maybe we will have a little bit of short-term pain but the long-term gain is definitely there when we look at the data.”
Stocks built up a head of steam in 2023, with the S&P 500 up 11% in the fourth quarter alone. This could translate to strength in the new year.
Data from LPL Research going back to 1950 showed that years following a gain of 20% or more have seen the S&P 500 rise an average of 10%. That compares to an average 9.3% annual return. Such years are also more frequently positive, with the market ending the year up 80% of the time, versus 73% overall.
“Momentum begets momentum,” Turnquist said. “I also believe themes that are capable of driving a market up (at least) 20% are typically durable trends persisting beyond a calendar year.”
LPL Research has a 2024 year-end target range for the S&P 500 of 4,850 to 4,950, but the firm sees potential upside above 5,000 if lower interest rates support higher valuations, companies achieve double-digit earnings growth and the U.S. economy avoids recession. The index was last at 4,765.
Investor hopes for an economic soft landing will get an early test next Friday, with release of the monthly U.S. employment report.
Ryan Detrick, chief market strategist at Carson Group, notes that stocks have seen strong gains after rebounding from steep drawdowns. Since 1950, there have been six times when the S&P 500 rebounded by at least 10% after falling 10% or more the previous year. Each time the index’s bounce continued for a second year, returning an average of 11.7%, Detrick’s data showed. The S&P 500 tumbled over 19% in 2022.
Detrick noted the data as part of a recent commentary on why 2024 “should be a good one for the bulls.”
Reaching a record high could be another bullish sign for stocks. Since 1928, there have been 14 instances of a gap of at least one year between S&P 500 all-time highs, according to Ed Clissold, chief U.S. strategist at Ned Davis Research. The S&P 500 went on to rise an average of 14% a year after a new high was reached, rising 13 of 14 times, according to Clissold.
Further tests of the market’s strength will arrive quickly. U.S. companies start to report fourth-quarter results in the next couple of weeks with investors anticipating a much stronger year for profit growth in 2024 after a tepid 3.1% increase in 2023 earnings, according to the latest LSEG estimates.
Investors are also awaiting the conclusion of the Fed’s first monetary policy meeting of the year in late January for insight into whether policymakers hew to the dovish pivot they signaled in late December, penciling in 75 basis points of rate cuts for 2024.
Indeed, signs the economy is starting to wobble following the 525 basis points in Fed rate hikes since 2022 could hinder momentum for stocks. By the same token, accelerating inflation in 2024 could delay expected rate cuts, putting the market’s soft-landing hopes on hold.
“History is a great guide, but never gospel, and I think we have to acknowledge that,” said Sam Stovall, chief investment strategist at CFRA.
However, data Stovall looks at foreshadows a solid 2024, including history regarding presidential election years. The S&P 500 has gained all 14 times in the year that a president has sought re-election, regardless of who wins, with an average total return of 15.5%, according to Stovall.
“Basically, all of the indicators that I look at point to a positive year,” Stovall said.


