Here’s the Biggest Risk Facing Stock Market in 2024
2023.12.29 04:32
- As 2024 approaches, the stock market’s course hangs in the balance, shaped by factors such as interest rates, inflation, and earnings.
- Making correct predictions is nearly impossible, as demonstrated by the wrong predictions made for 2023.
- Even then, being prepared for risks is a part of sound financial planning. So let’s take a look at a few risks markets might face next year.
- Looking to beat the market in 2024? Let our AI-powered ProPicks do the leg work for you, and never miss another bull market again. Learn More »
The question on everyone’s mind right now is: What does 2024 have in store for markets?
While it might appear mundane, the trajectory of the stock market in the upcoming year is anything but certain.
It could persist in its upward trend or pivot downward, contingent on factors like interest rates, , economic growth in major regions, corporate earnings, investor sentiment, or any unforeseen events.
Up to this point, the most substantial risk might be presuming a predetermined course for the market.
I’m not suggesting that forecasting is unwarranted; it’s crucial for future financial planning. However, we should be prepared for unforeseen developments and factor them into our plans.
In essence, absolute certainty often carries the risk of being proven wrong—a phenomenon not uncommon in our daily lives.
Don’t believe predictions; they are often wrong
Last year, at the same time as we are today, the Financial Times published a survey that more than 80% of economists were certain, thus predicting with certainty, a recession in 2023.
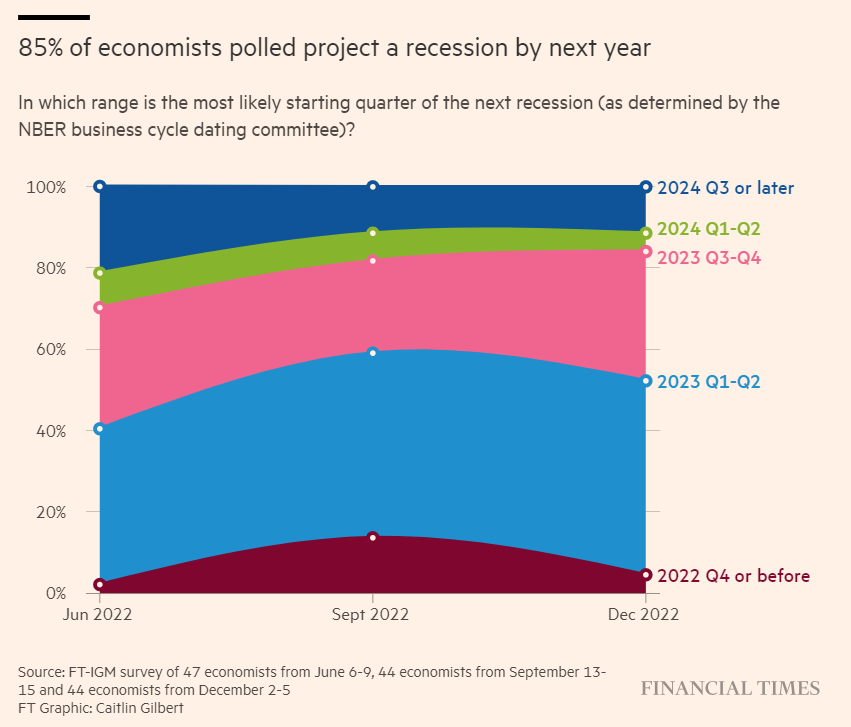
Do you still think a recession is coming? People, in general, are often bound to be wrong, and as I said before, it is appropriate to expect anything.
I think, as with 2023, we will have to try to ride the market rather than outperform it, and if predicting the future is difficult perhaps it would be wiser to start with what we know.
For much of 2023, we saw investors’ money flow into Treasuries, then we saw the largest outflow from Treasuries since June 2020 into equities.
Flows into equity funds have seen the largest inflows in 2 months since March 2022, and more and more people are chasing the rally.
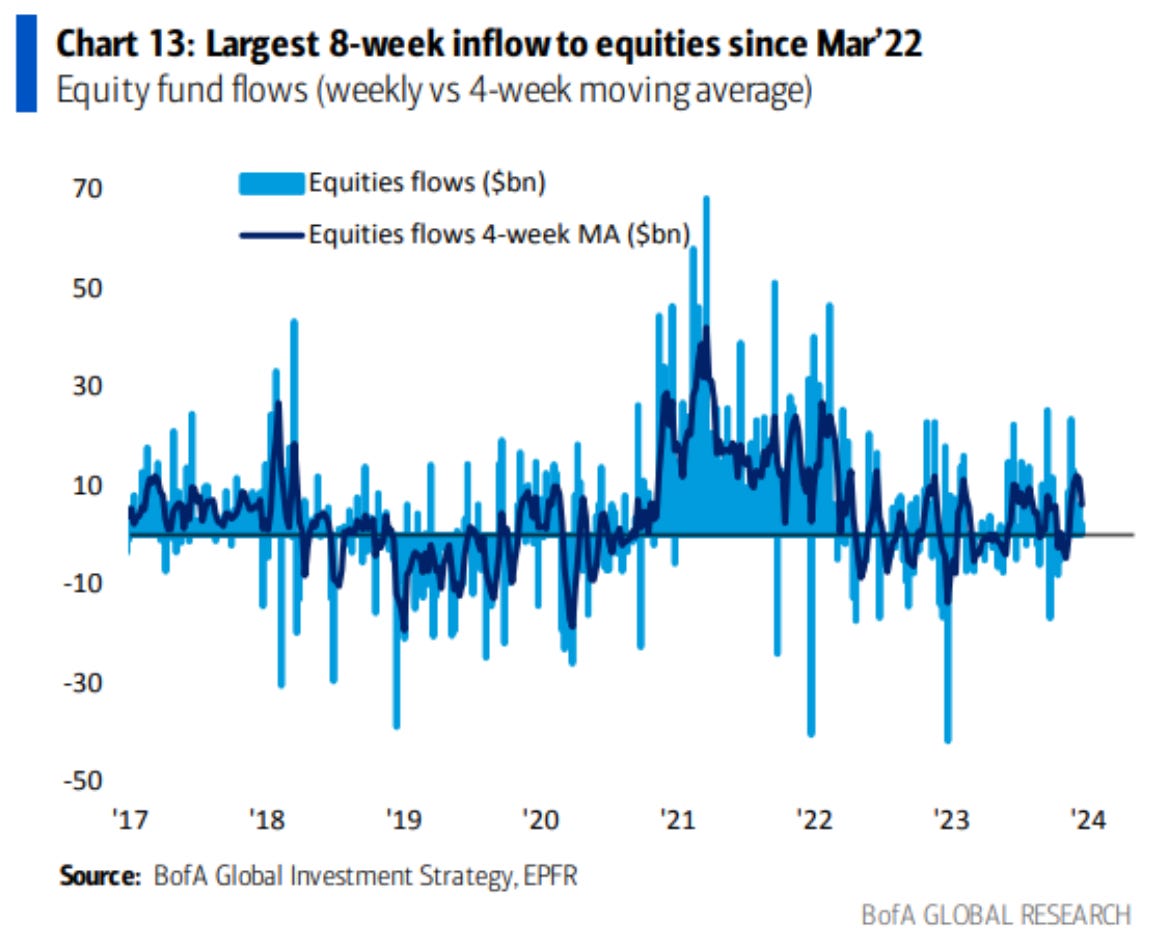
Equities, to date, have simply followed their seasonal trends. There is nothing to worry about (at the moment).
It is when markets ignore their seasonal trends that we need to pay attention; the onset of weakness during a seasonally strong period of the year, such as late December and January, could be a sign that the trend is worsening.
One data point worth monitoring is the that have changed their trend as the continues to rise.
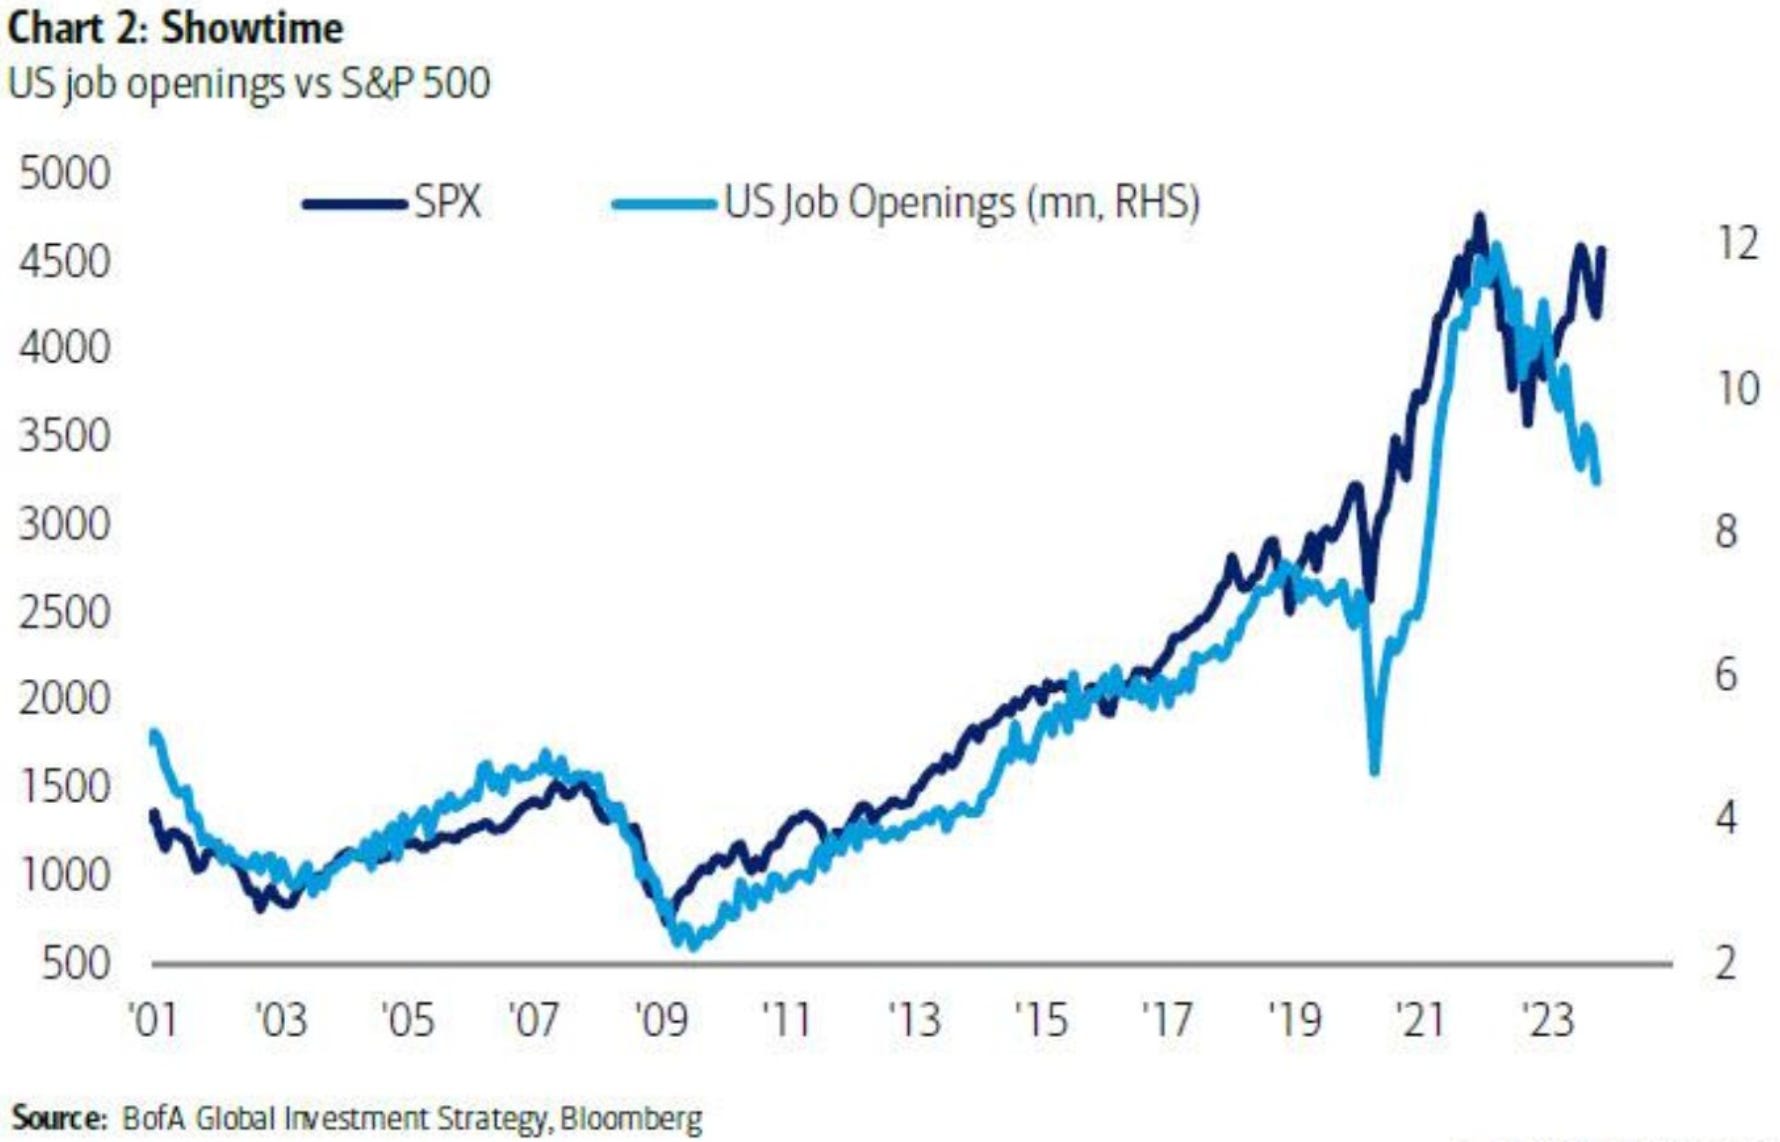
This is not the typical scenario; examining the data from 2000 onwards reveals a consistent pattern where each decline in the data is reliably succeeded by the reversal of the S&P 500.
What’s actually driving stocks?
One significant factor is a weak . Interestingly, when the dollar is strong, stock prices tend to decline.
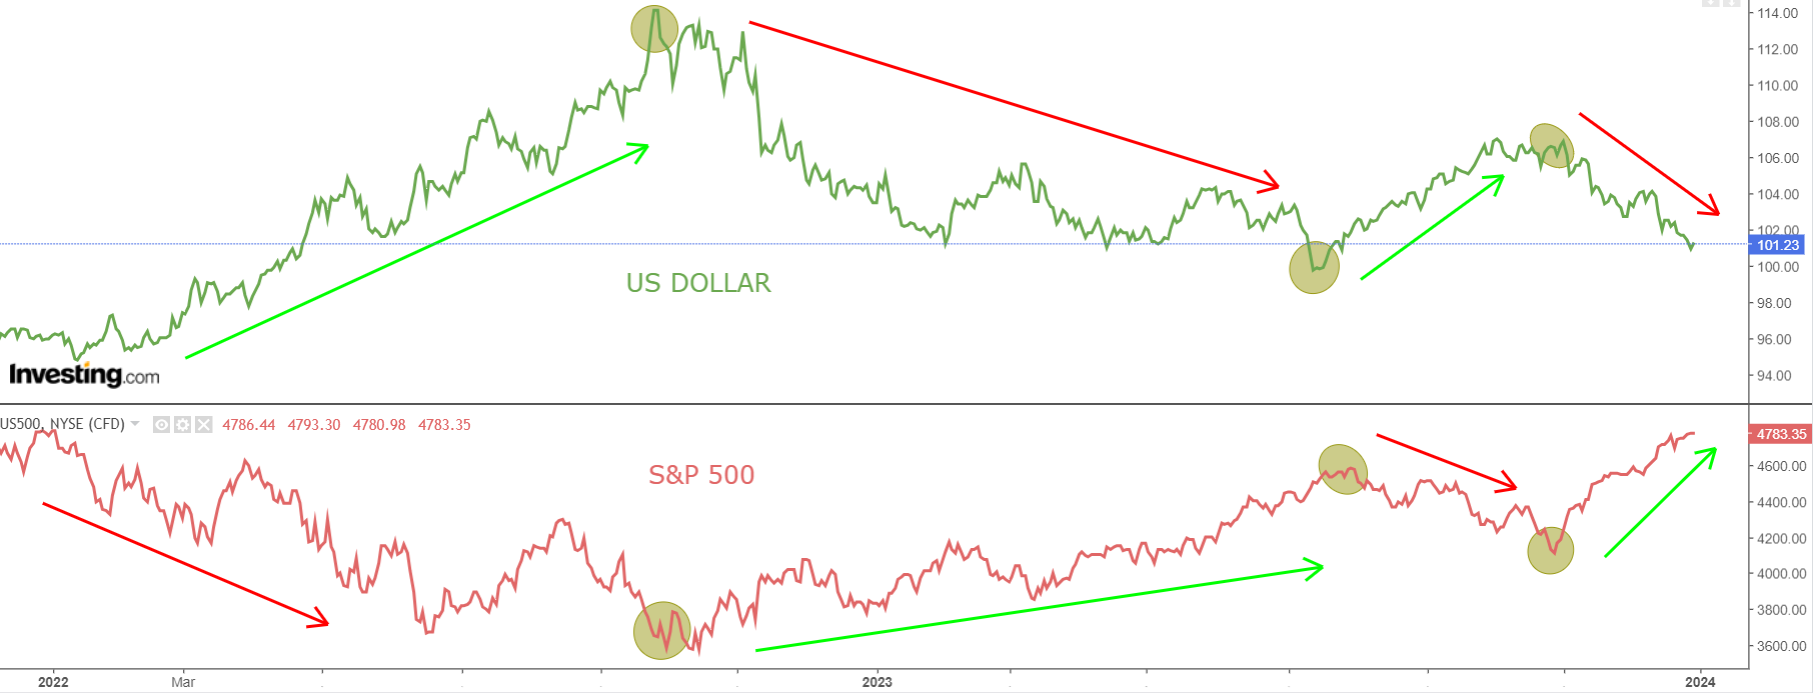
After the peak in September 2022, the dollar went down while there was a reversal for the S&P 500, from there on, stocks went upward.
We can say that as long as there is a dollar with a bearish trend, the stock rally could continue. This is supported by investor sentiment toward risky, non-defensive stocks.
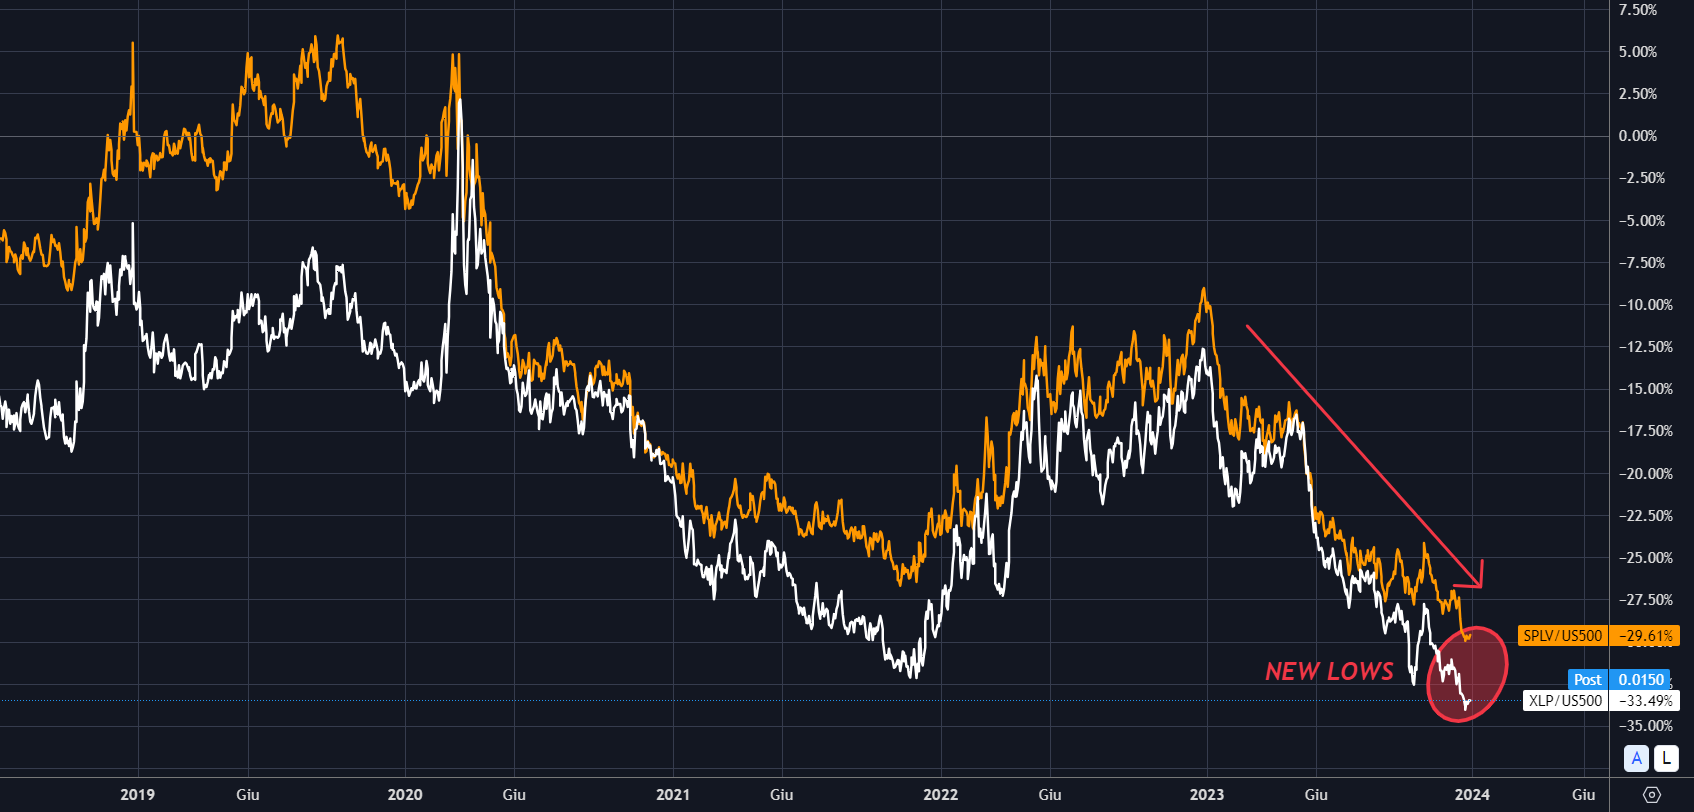
We are seeing the exact opposite of what should be apparent in the case of a bearish market-there is no rotation toward defensive stocks with low volatility and on consumer goods.
Should we continue to think that things will be fine?
According to a Bloomberg article, the S&P 500 has created the third wave of the “Elliott theory,” which is generally the most powerful and extensive.
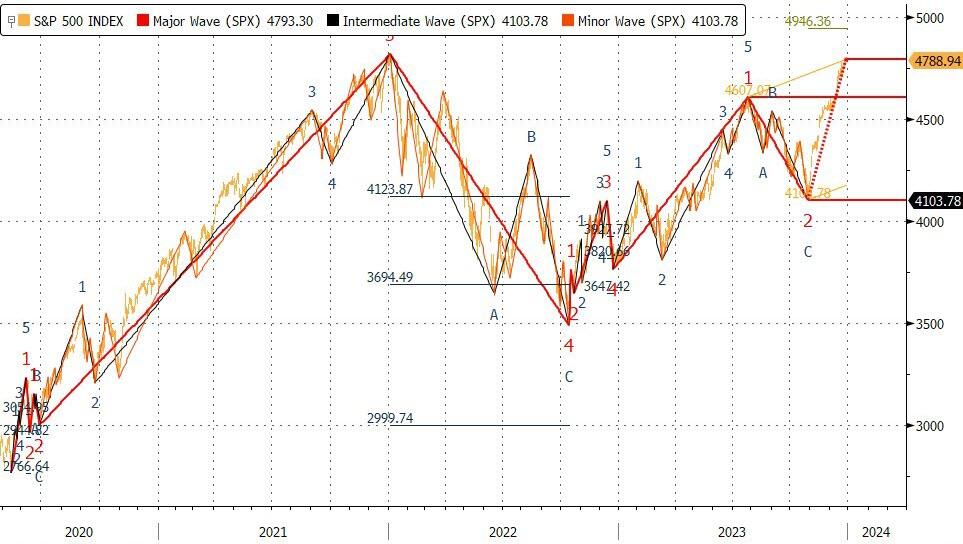
The index has approached all-time highs that could be broken in the coming days with the possibility of touching 4900 in the coming weeks.
Once the strength of the third wave is over, however, the index will tend to create the fourth, which as you well know represents a correction.
The past wave 2 of correction, started in January 2022 and lasted about 10 months with a drop of 20-25%.
Will the rally last much longer? we shall see.
Until then, happy holidays!
***
In 2024, let hard decisions become easy with our AI-powered stock-picking tool.
Have you ever found yourself faced with the question: which stock should I buy next?
Luckily, this feeling is long gone for ProPicks users. Using state-of-the-art AI technology, ProPicks provides six market-beating stock-picking strategies, including the flagship “Tech Titans,” which outperformed the market by 670% over the last decade.
Join now for up to 50% off on our Pro and Pro+ subscription plans and never miss another bull market by not knowing which stocks to buy!

Claim Your Discount Today!
Disclaimer: This article is written for informational purposes only; it does not constitute a solicitation, offer, advice, counseling or recommendation to invest as such it is not intended to incentivize the purchase of assets in any way. As a reminder, any type of asset, is evaluated from multiple perspectives and is highly risky, and therefore, any investment decision and the associated risk remains with the investor.


