Gold Bulls Eye $2200 in 2024 as Rate Cut Expectations Grow: Key Levels to Watch
2023.12.26 04:00
- Gold maintains a positive outlook, holding above long-term support at $2050 after reaching $2,148 in early December.
- The elevated demand for gold is attributed to growing expectations that the US Federal Reserve will initiate interest rate cuts in March 2024.
- Markets are currently anticipating rate cuts of up to 150 basis points, reinforcing the narrative that 2024 could be bullish for gold.
The final week of the year is underway and has maintained a positive outlook, holding above its long-term resistance price.
In the initial half of December, gold surged to a record-breaking $2,148 but experienced a partial decline due to profit booking. The latter half of the month witnessed a recovery trend.
The elevated demand for gold is attributed to growing expectations that the US Federal Reserve will initiate interest rate cuts in March 2024.
This anticipation led to a decrease in US Treasury yields. Coupled with a waning demand for the , the drop restored gold to its early December price levels.
Given the current landscape, investors anticipate that the might aggressively reduce interest rates by up to 150 basis points starting in March 2024.
This reinforces the narrative that the upcoming period could be the year of commodities, sustaining the bullish outlook for gold, the commodity with the highest trading volume.
Throughout 2023, gold’s safe-haven status supported prices amid escalating geopolitical risks. The ongoing conflicts in Ukraine and Gaza could spill into 2024 and fuel yellow metal’s bullish outlook next year.

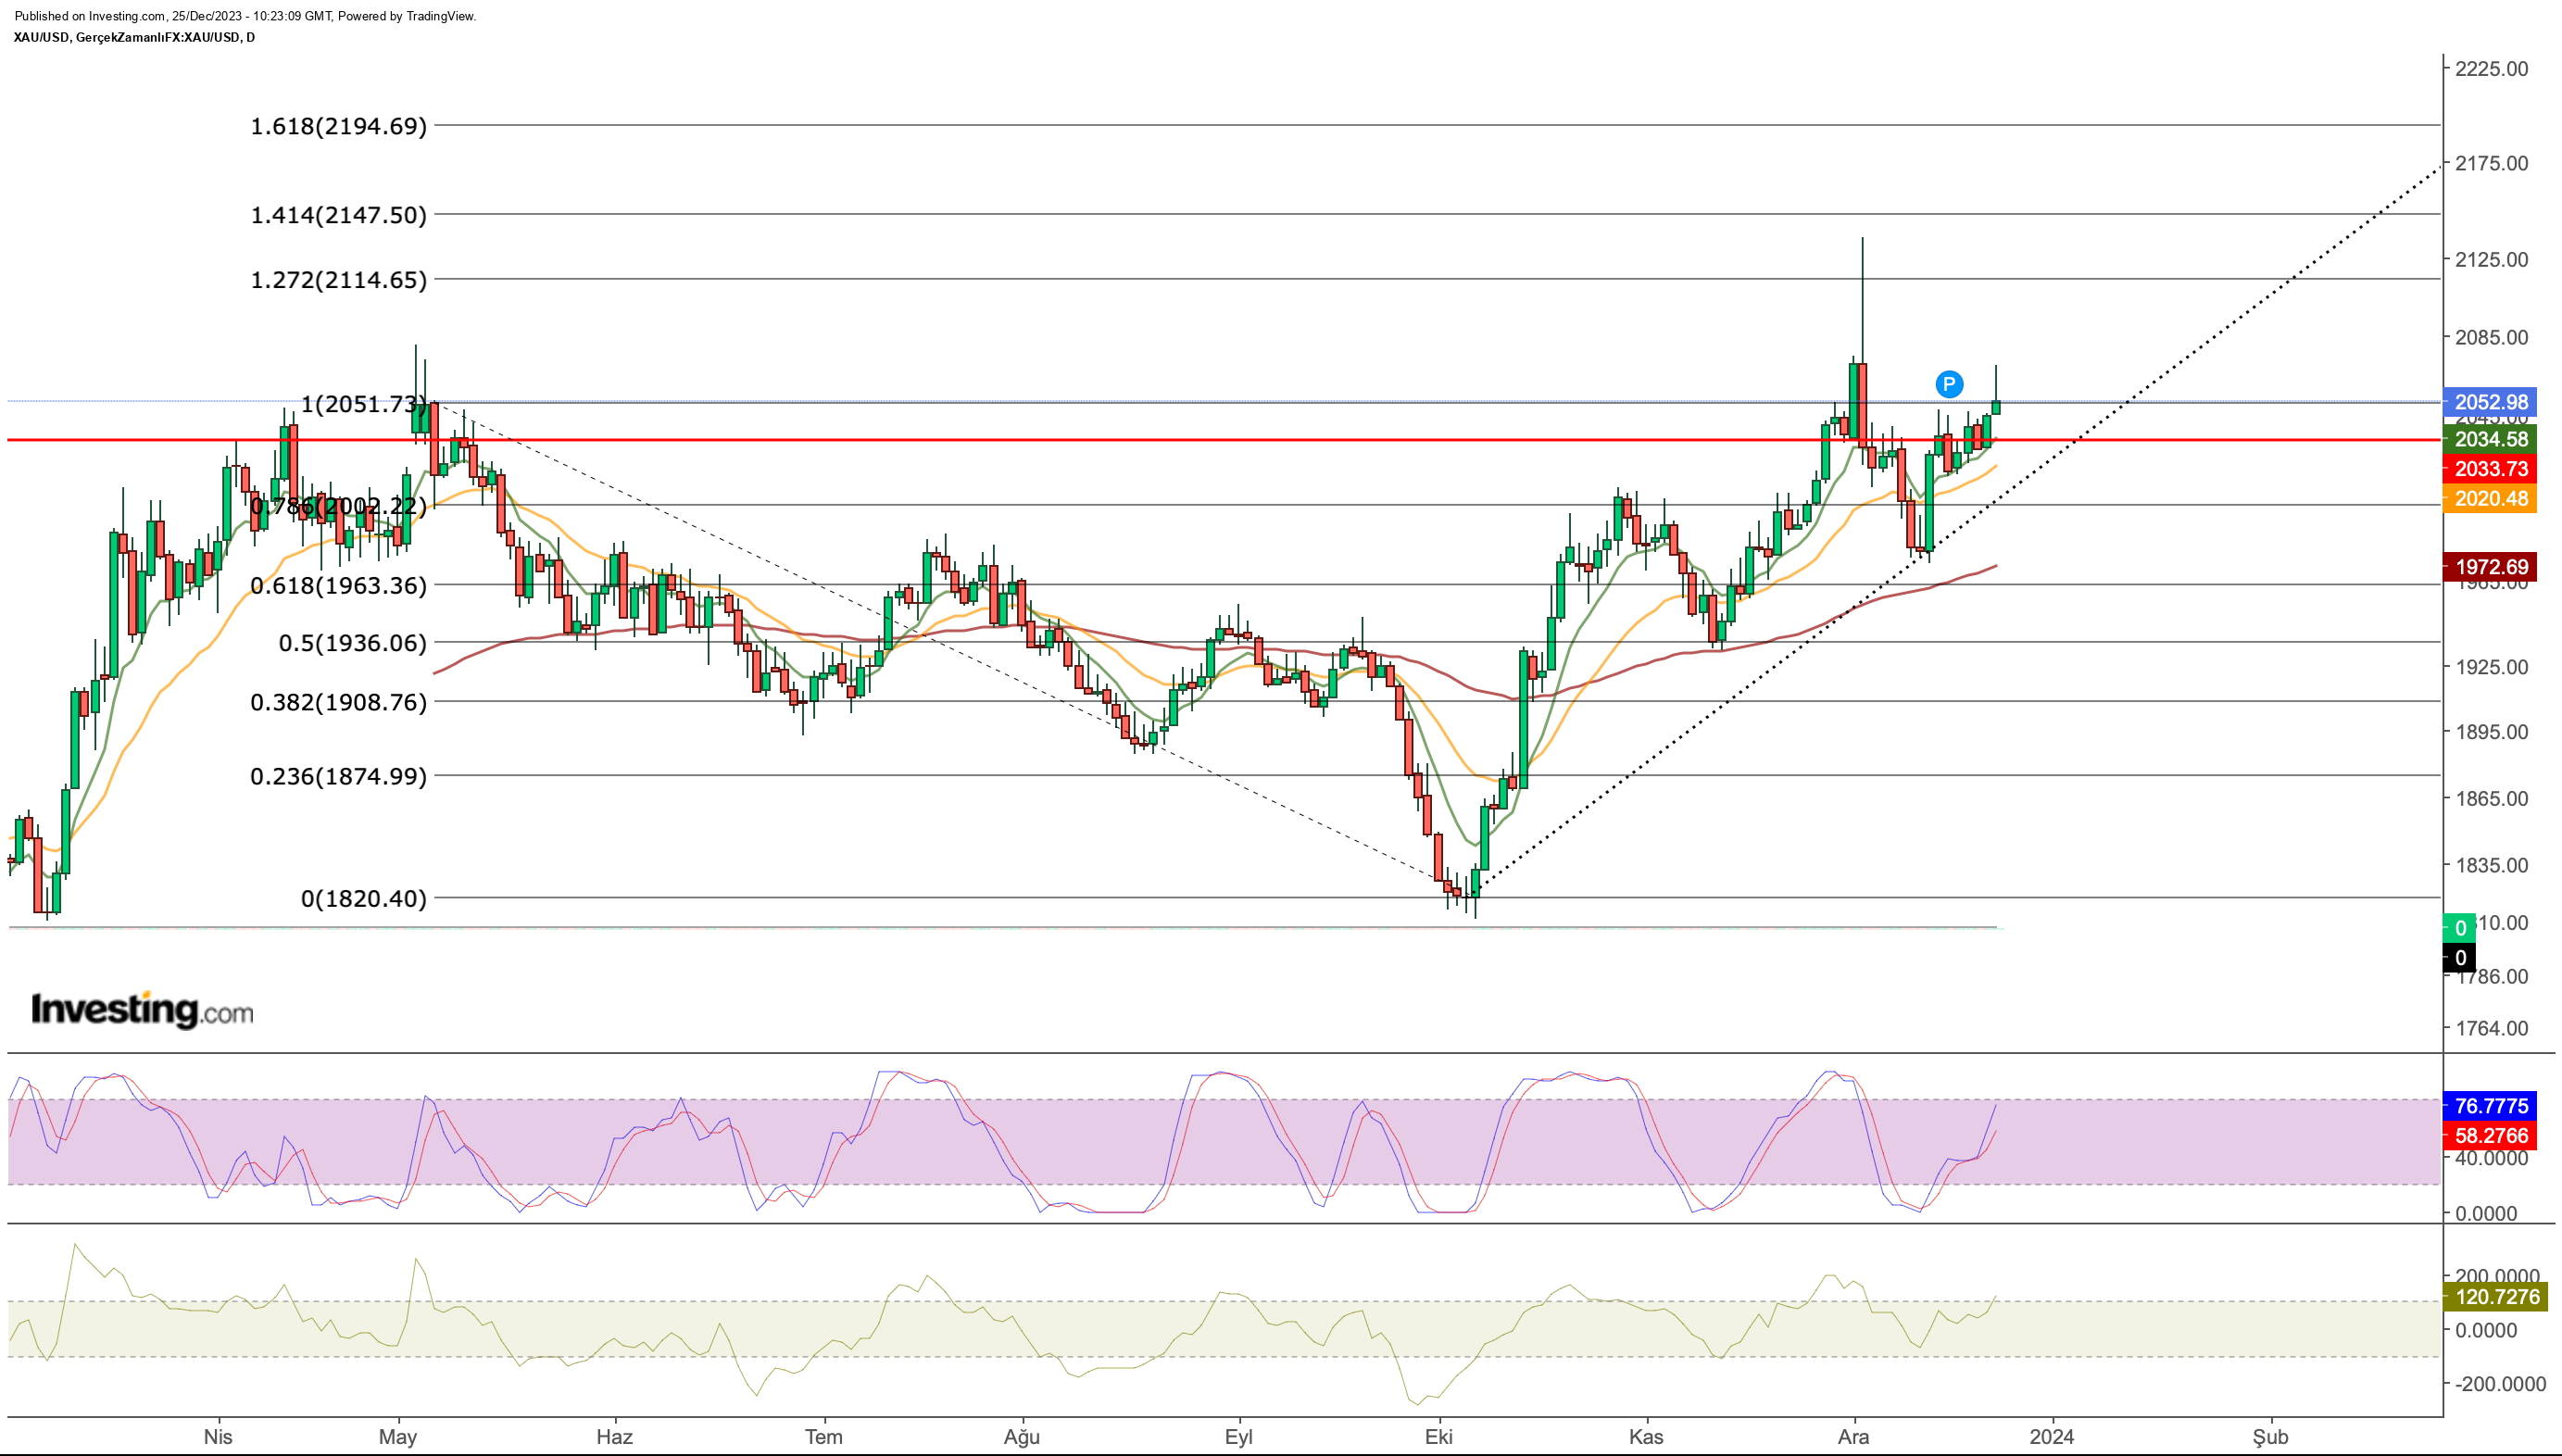
If we examine the chart, the upward turn from the $ 1,970 band last week ensured the continuation of the recovery that started in October.
The gold price managed to close the week above the area we follow as the long-term resistance zone in the range of $ 2,030 – $ 2,050.
If we look at the price action in the second half of 2023; After the first move above the resistance area failed in December, a more robust upward trend is noteworthy in the current situation.
If gold can end the year 2023 above the last closing peak in the $ 2,070 band, it may continue to increase its momentum in the first week of January.
In this case, a bullish line extending up to $ 2,200 according to Fibonacci levels draws attention. On this path, the $2,115 and $2,150 levels will be followed as intermediate resistances.
On the daily chart, short-term exponential moving average (EMA) values support the positive outlook, while the outlook of the Stochastic RSI indicates that there is a little more room for upside.
The nearest price of $2,035 stands out as support in the lower zone. This price level is an important support as the boundary of the 8-day EMA and the long-term resistance line.
In a possible breakout, we can see that this time the correction phase may continue up to $1,970, which corresponds to the 3-month EMA value.
However, the high confidence in the commodity market in 2024 may ensure that possible declines remain limited compared to the possibility of being seen as a buying opportunity.
US Dollar: Greenback Continues to Head Lower
On the dollar side, after the latest data released last week, the continued easing of pressures increased the likelihood that the Fed would cut interest rates sooner than expected.
On the other hand, the decline in US annual inflation below 3% is the most important indicator that the tight monetary policy is starting to bear fruit.
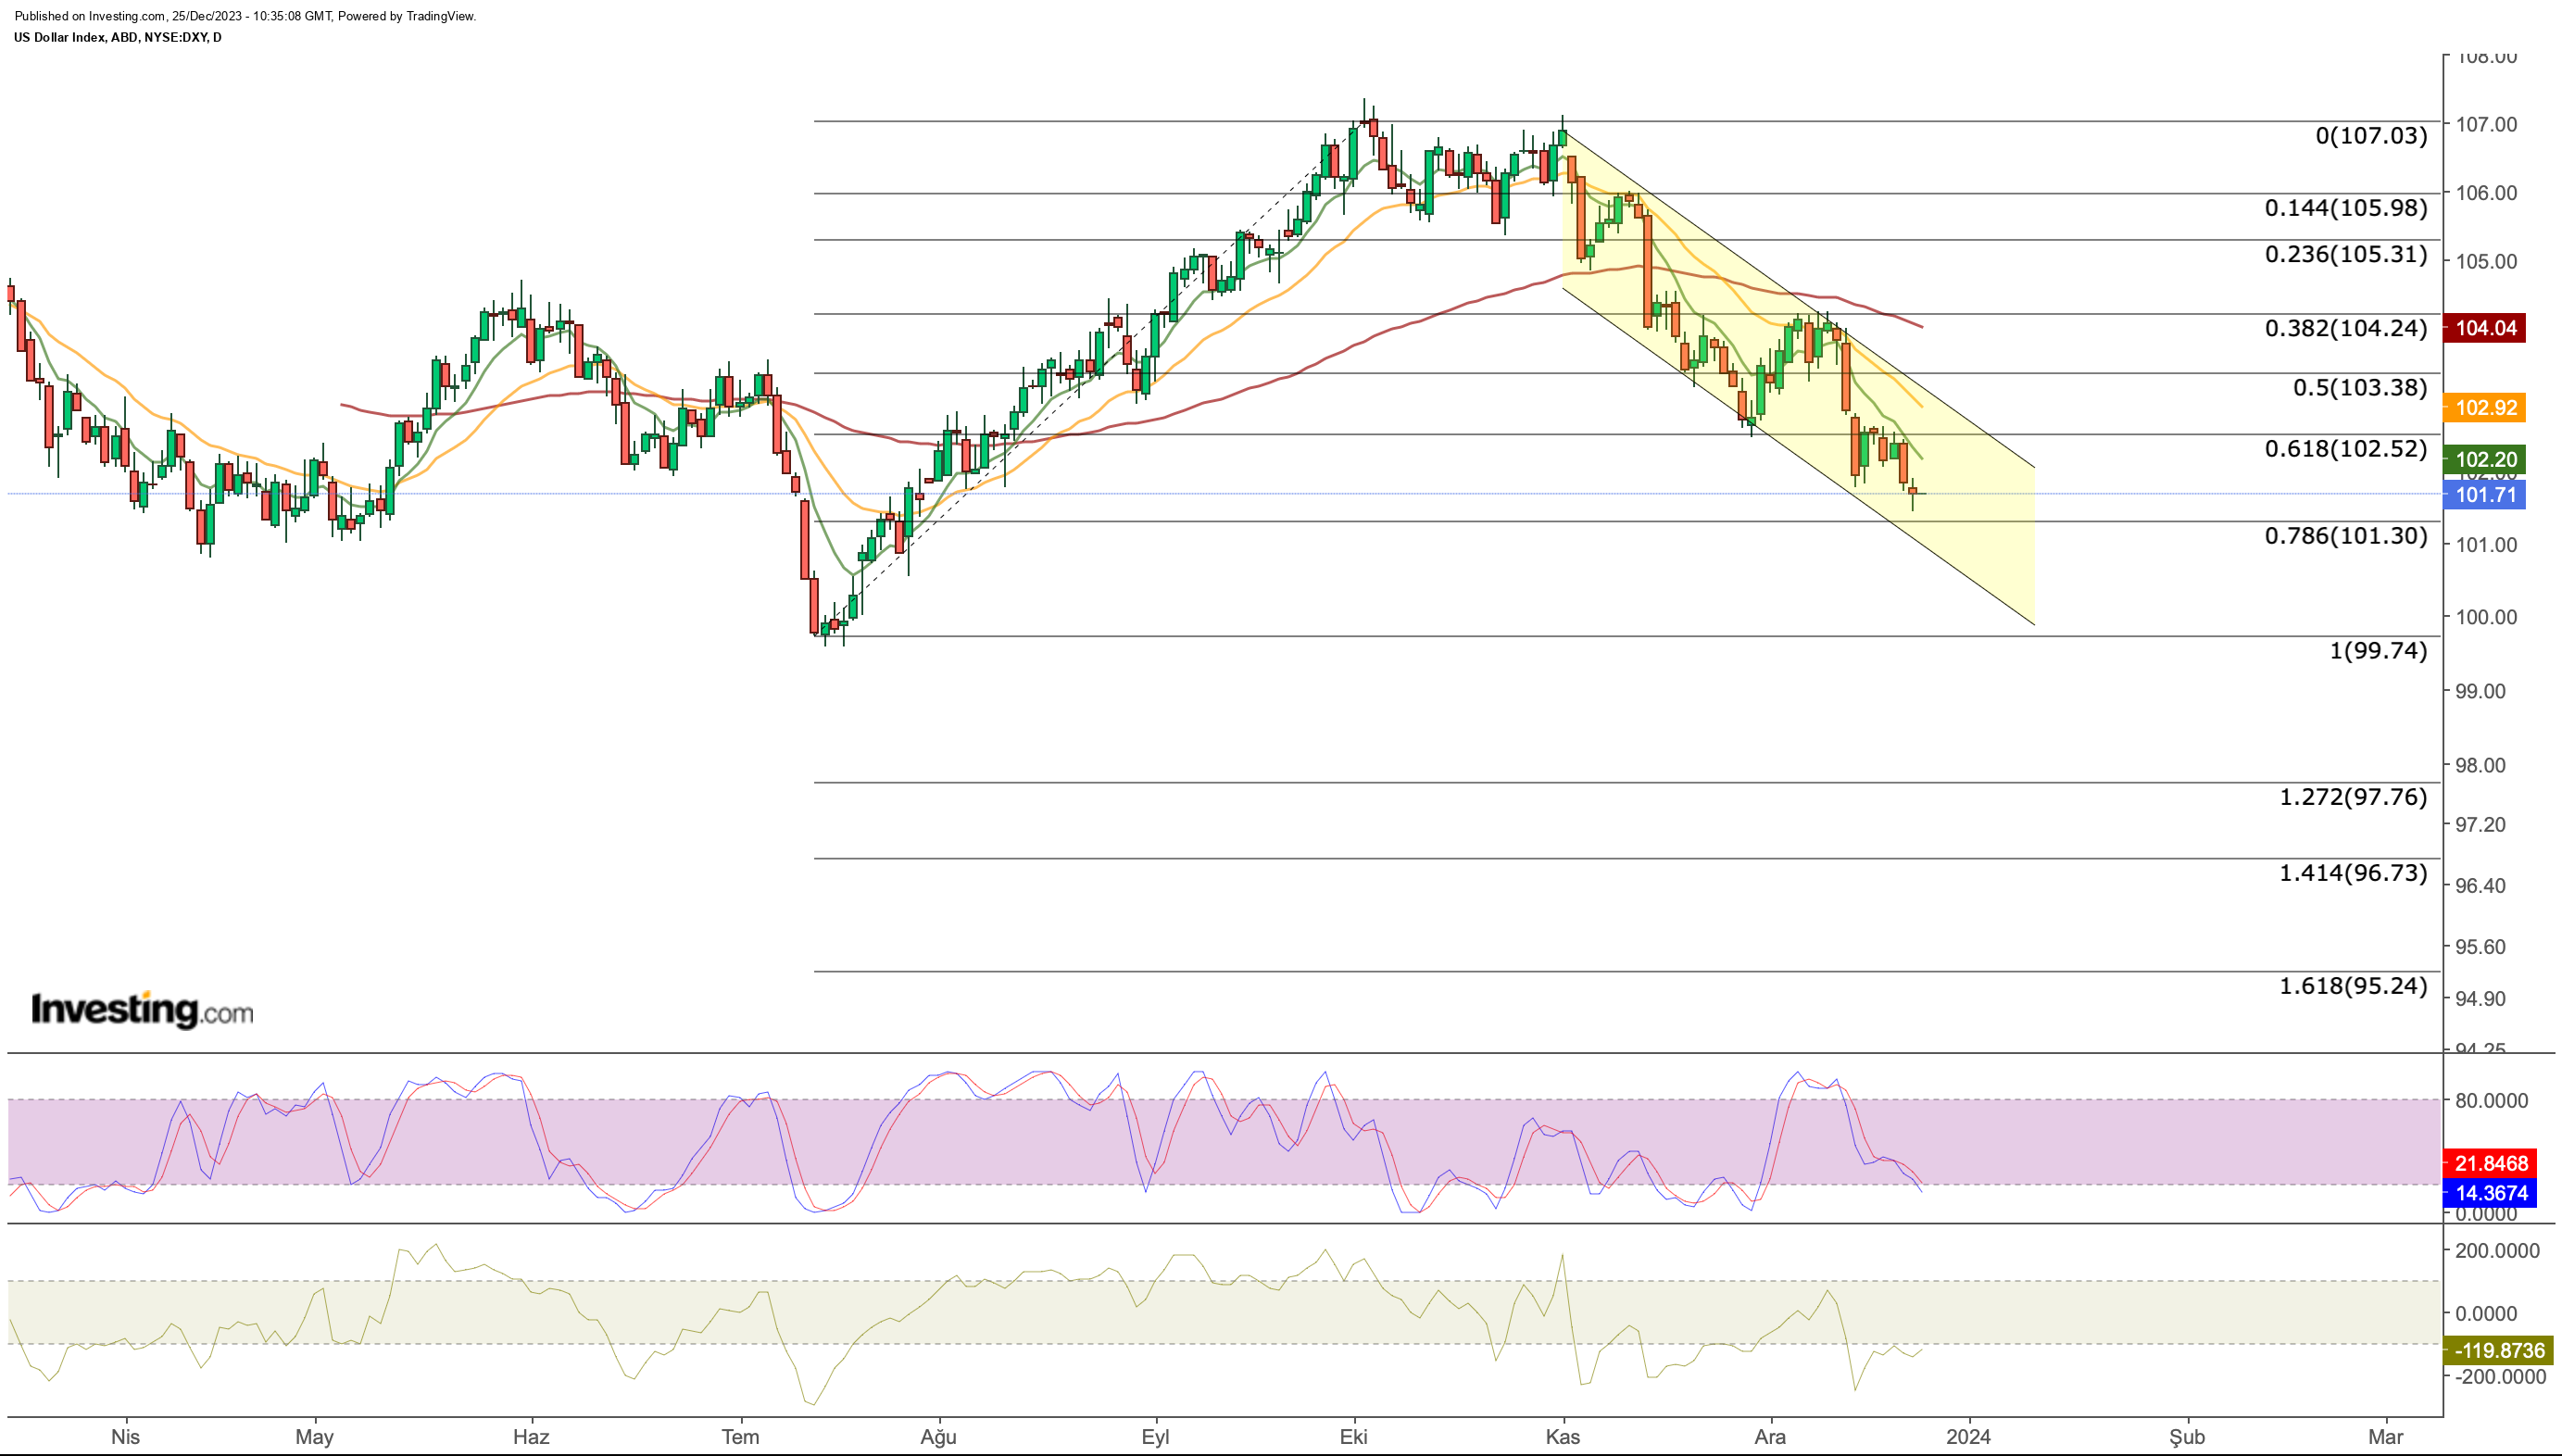
The US dollar carried the downward momentum of November into December, falling to the 101 band and hitting its lowest level in the last 5 months.
The decline in benchmark bond yields to the lowest levels since July supports the weak course in the .

From a technical point of view, it is seen that DXY, which has been moving in a steeply accelerating falling channel since November, has reached Fib 0.786 (101.3), which can be considered as an important support line according to the recent uptrend.
In the reaction purchases that may come at this point, may see reaction purchases towards the 102.5 level, which also coincides with the upper band of the channel.
However, as long as there is no change in the current outlook, the downward trend of the DXY is likely to continue along the channel.
In weekly closures below the average 101.3 support in DXY, the bottom level in July will become important in the 99 band, and a possible breakout may trigger a decline to the 95 level.
***
In 2024, let hard decisions become easy with our AI-powered stock-picking tool.
Have you ever found yourself faced with the question: which stock should I buy next?
Luckily, this feeling is long gone for ProPicks users. Using state-of-the-art AI technology, ProPicks provides six market-beating stock-picking strategies, including the flagship “Tech Titans,” which outperformed the market by 670% over the last decade.
Join now for up to 50% off and never miss another bull market by not knowing which stocks to buy!

Claim Your Discount Today!
Disclosure: The author holds no positions in any of the asset classes mentioned.


