Fed staff say balance sheet runoff could strain Treasury market
2022.07.14 17:38

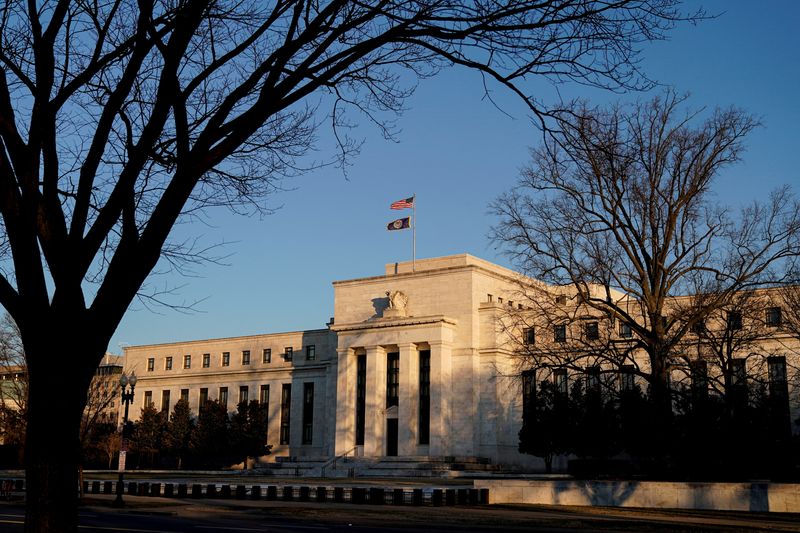
FILE PHOTO: The Federal Reserve building is seen in Washington, U.S., January 26, 2022. REUTERS/Joshua Roberts
By Howard Schneider
WASHINGTON (Reuters) – Two new analyses from Federal Reserve staff have concluded that strains in the U.S. Treasury market could complicate the central bank’s plans to reduce its balance sheet by amplifying the effect of those reductions on financial markets and raising interest rates more than anticipated.
The papers, from researchers at the Atlanta and Kansas City Fed regional banks, are similar to other efforts to estimate how markets may be influenced as the Fed allows the trillions of dollars of securities it bought to support the economy during the coronavirus pandemic to mature and “roll off” its balance sheet.
But, unlike the relatively calm conditions that prevailed in 2017 when the Fed last reduced its balance sheet, this round of “quantitative tightening” (QT) is coming as uncertainty about the economy, increases in Fed short-term interest rates, and other factors have strained the key market for U.S. Treasuries.
Atlanta Fed researcher Bin Wei estimated that during “normal” times reductions in the Fed’s holdings of U.S. Treasury bonds by around $2.2 trillion over the next three years would have the equivalent impact of immediately increasing the short-term federal funds policy rate by about 0.29 percentage points.
That is a modest amount, and similar to a figure Fed Chair Jerome Powell has used when asked how the central bank’s balance sheet plans would further tighten credit conditions beyond any increases in the policy rate the Fed is planning.
Yet in times of heightened volatility or stress in the Treasury market, he concluded, it would carry the punch of nearly three typical rate increases, or about 0.74 percentage points – a hefty blow that could tighten monetary policy more than the Fed expects.
The balance sheet reductions began in June, and while they will scale up to as much as $95 billion each month, the first weeks saw the Fed’s $8.9 trillion stock of Treasuries and mortgage-backed securities (MBS) fall by only about $40 billion.
Still, analysts outside the Fed have already begun connecting recent strains in the Treasury market – from higher volatility to increased bid-ask spreads – to potential trouble for the U.S. central bank and an early end to its balance sheet reductions.
“We wouldn’t say that the Treasury market is stressed” as it stands, Piper Sandler analysts Roberto Perli and Benson Durham wrote last week. “But poor liquidity conditions no doubt exacerbate the already existing volatility. They might also induce the Fed, which cares deeply about Treasury market functioning, to stop QT sooner than it thinks at the moment.”
GRAPHIC: Bond market volatility https://graphics.reuters.com/USA-FED/QT/zjpqkzwmrpx/chart.png
The Fed has not specified a stopping point – the required size of its balance sheet in normal times hinges on things like public demand for cash and bank demands for Fed-held reserves. But analysts have pointed to a possible run-off of $2 trillion to $3 trillion in its holdings of Treasuries and MBS.
UNSETTLED MARKET CONDITIONS
In a separate paper, Kansas City Fed economists Rajdeep Sengupta and A. Lee Smith draw a contrast with the currently unsettled state of markets and the tranquil conditions that prevailed in 2017 when the Fed allowed securities purchased in the aftermath of the 2007-2009 financial crisis to mature and fall off the central bank’s books.
The economy was still enjoying what would become a record-long expansion, and markets functioned smoothly as the Fed allowed its holdings to decline by $50 billion monthly. But even that relatively benign round of QT came to an abrupt end when bank overnight lending rates spiked in 2019, a sign the Fed had gone too far after a run-off of around $650 billion.
The pace of reductions this time will be nearly twice as fast, and the ambitions are for a total run-off of perhaps $2 trillion to $3 trillion.
The Kansas researchers noted that some key customers for Treasuries, such as pension funds and mutual funds, are already holding near record-high amounts and may “have limited capacity to absorb” the new bonds the government will have to sell to repay the Fed. Given current geopolitical tensions in the world, foreign demand may be limited too.
GRAPHIC: Treasury market liquidity https://graphics.reuters.com/USA-FED/QT/lgpdwzneevo/chart.png
The reverse could occur, of course: Times of tension sometimes have the effect of drawing capital in search of a safe haven to the United States, a dynamic exemplified currently by falling U.S. Treasury yields and a stronger dollar.
But uncertainty, by any measure, is high, and the risks greater than when the Fed trimmed its balance sheet prior to the pandemic. If buyers become scarcer at the margin for U.S. debt, it will mean higher-than-anticipated interest rates.
“The contrast between the currently unsettled state of market conditions and the tranquil conditions that prevailed in 2017 suggests that this QT episode has the potential to be more disruptive compared with the benign start to the 2017 runoff,” Sengupta and Smith wrote.


