Consumer giants are winners as shoppers swallow price hikes
2022.10.19 19:20
[ad_1]

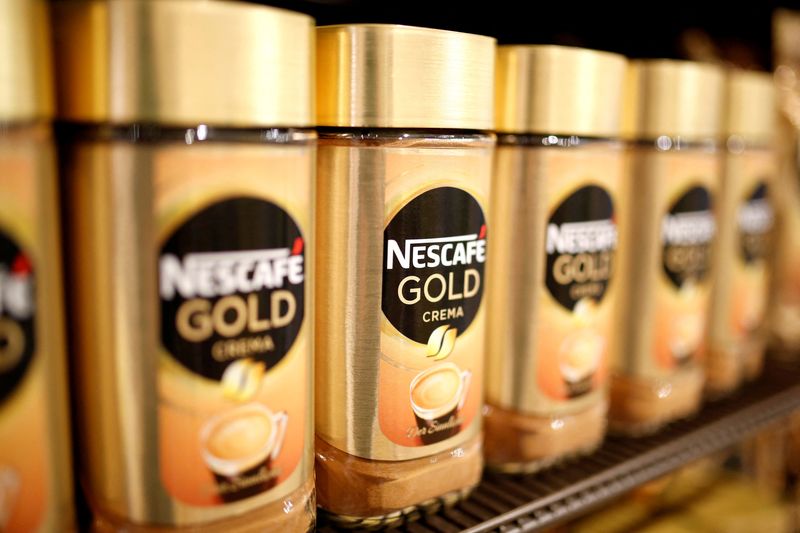
© Reuters. FILE PHOTO: Jars of Nescafe Gold coffee by Nestle are pictured in the supermarket of Nestle headquarters in Vevey, Switzerland, February 13, 2020. REUTERS/Pierre Albouy/File Photo
By Richa Naidu, Jessica DiNapoli and John Revill
ZURICH/LONDON (Reuters) – Nestle and Procter & Gamble (NYSE:), the world’s two biggest consumer firms, reported better-than-expected sales on Wednesday, as shoppers continued to pay more for goods like Nescafe coffee and Gillette razors despite record inflation.
Nestle, which also makes Cheerios cereal and KitKat chocolate bars, reported better-than-expected sales results, successfully passing higher costs on to shoppers as rocketing food prices around the world drive record inflation.
Similarly, Tide detergent maker P&G beat estimates for quarterly sales and profit, helped by price hikes on everything from Head & Shoulders shampoo to Gillette razors, even as a stronger dollar weighed on its revenue from overseas markets.
Consumer companies – many of which thrived during COVID-19 as people stockpiled their products – are once again emerging as winners in a time of global crisis, maintaining double-digit margins as people are forced to pay more for everyday products.
People are also eating at home more as the cost-of-living crisis discourages them from going to restaurants. Demand for food and household consumer goods has so far fallen at a slower pace than discretionary products like apparel and electronics, as consumers prioritise spending on essential items.
“We are also seeing consumers moving to two different price points,” said P&G finance chief Andre Schulten.
“A group of consumers is looking for value by trading into higher transaction sizes to find lower cost per use, or lower cost per unit. And we see other consumers who are more cash-conscious, and they are very focused on cash outlay.”
The sector has faced margin pressure over the past 18 months due to rising costs, but Nestle reiterated its target for a trading operating profit margin of around 17%.
Britain’s consumer price index increased by 10.1% in September, driven by the biggest jump in food prices since 1980. Euro zone inflation also zoomed past forecasts in September to nearly 10%. Prices meanwhile increased by 8.2% in the United States, stretching the pockets of consumers already spending more on fuel bills and mortgage payments.
Nestle posted its strongest nine-month sales growth in 14 years and raised its full-year guidance. Organic sales, which cut out the impact of currency movements and acquisitions, rose by 8.5% in the nine months to end-September. It was the highest nine-month rise since 2008 and was driven by higher prices aimed at offsetting rising costs.
“We delivered strong organic growth as we continued to adjust prices responsibly to reflect inflation,” the company’s chief executive Mark Schneider said.
P&G said average prices across its product lines rose 9% in the first quarter ended Sept. 30, while sales volumes fell 3%.
“We’ve priced in the last fiscal year on all 10 of our product categories,” CFO Schulten said.
Shares in Nestle were up 0.2%, while P&G rose 2%.
Their results bode well for rival food giant Unilever (NYSE:) and Dettol maker Reckitt, which both report results next week.
But despite the strong sales, some analysts worried price rises could soon push consumers too far, potentially pricing some of its products out of their reach amid a cost of living crisis that is seeing sales volumes across the industry decline.
“You do worry about the pricing power category by category particularly for discretionary food – nobody really needs a KitKat or an ice cream,” said Chris Beckett, head of equity research at Quilter Cheviot.
“Sales volumes have held up well so far but we are a way from peak cost-of-living squeeze.”
Nestle’s Schneider raised concerns about the “challenging” economic environment, which he said was hurting the purchasing power of many customers.
($1 = 0.9953 Swiss francs)
[ad_2]
Source link


