Column-Soft China PMI likely to flow through to uneven commodity demand: Russell
2023.05.01 00:56

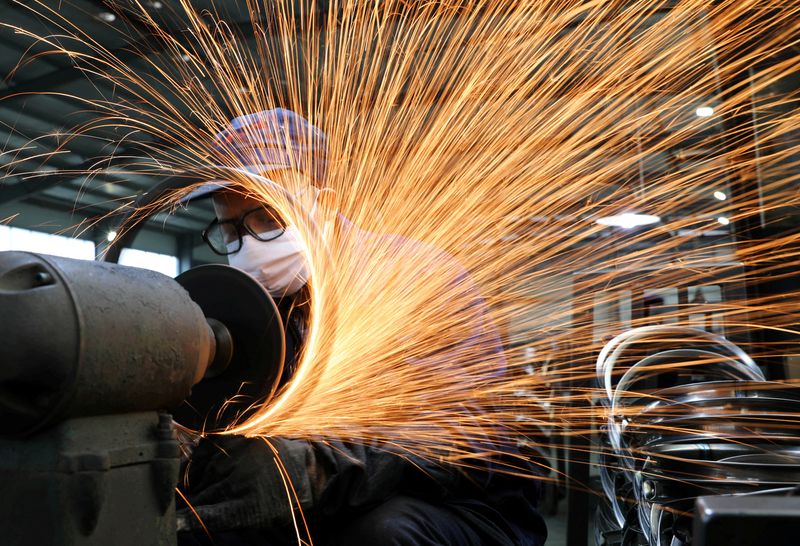
© Reuters. FILE PHOTO: A worker wearing a face mask works on a production line manufacturing bicycle steel rim at a factory, as the country is hit by the novel coronavirus outbreak, in Hangzhou, Zhejiang province, China March 2, 2020. China Daily via REUTERS/File Ph
By Clyde Russell
LAUNCESTON, Australia (Reuters) – The surprise contraction in China’s manufacturing index in April, coming after first quarter growth exceeded expectations, underlines the uneven nature of the recovery in the world’s second-biggest economy.
This variable economic story is likely to be mirrored in China’s imports of major commodities, with strength in some areas being offset by more modest demand in others.
The official manufacturing Purchasing Managers’ Index (PMI) dropped to 49.2 in April from 51.9 in March, slipping below the 50-level that demarcates expansion from contraction for the first time since December.
The PMI was also below market expectations for a positive outcome of 51.4.
Among the components of the PMI showing weakness were new export orders, with this sub-index declining to 47.6 in April from 50.4 in March.
Manufacturing is one of the key pillars of China’s economy from a commodity demand perspective, the others being construction and infrastructure.
The news here is somewhat mixed, with infrastructure investment rising 8.8% year-on-year in the first quarter, outpacing a 5.1 rise in overall fixed-asset investment, while property investment fell 5.8%.
The overall picture for the steel and intensive sectors is cloudy, with some areas of strength, but others still struggling to regain momentum after losing steam during China’s strict zero-COVID period, which ended in December.
If manufacturing, construction and infrastructure are uneven, what is the source of the strength in China’s economy, given that first quarter growth exceeded expectations?
Gross domestic product rose 4.5% in the first quarter, beating market forecasts for a 4.0% gain, but much of the outperformance was driven by retail spending, which isn’t especially supportive of steel and copper demand.
However, retail spending does help drive demand for energy commodities, such as transport fuels like gasoline and jet fuel, as well as coal for electricity demand as consumers buy more appliances and services.
This can be seen in the relatively strong performance for energy imports in recent months, with imports rising 6.7% in the first quarter from the same period a year earlier.
However, it must be noted that some of the additional crude imported was re-exported as refined fuels, with shipments of products jumping 59.8% in the first quarter as refiners took advantage of new export quotas and solid margins for diesel in regional markets.
COAL SOARS
Coal imports are unambiguously strong, jumping 96.1% in the first quarter, albeit off a low base from the same period in 2022.
Seaborne thermal coal prices were competitive with domestic Chinese coal, encouraging imports to meet rising power demand, which lifted by 5.1% in March year-on-year, and by 2.4% in the first quarter.
Seaborne coal imports may have declined slightly in April, with commodity analysts Kpler estimating arrivals of 33.8 million tonnes, down from 34.2 million in March.
However, this would actually be an increase on a per day basis, with April coming in at 1.13 million tonnes a day, up from 1.10 million in March.
Crude oil imports are estimated at 10.77 million barrels per day (bpd) in April by Refinitiv Oil Research, down from the 34-month high of 12.37 million bpd in March, as refinery maintenance cut some demand.
Outside of the energy commodities, the picture is more one of steady demand, with iron ore imports likely much the same in April as they were in March.
China imported about 98.67 million tonnes of seaborne iron ore in April, according to Kpler, which would be down slightly on March’s customs data of 100.23 million, but similar to coal, this would actually be a small increase on a per day basis.
Copper imports have also been soft so far in 2023, with arrivals of the key industrial metal slipping 12.6% in the first quarter from the same period a year earlier.
It’s also worth noting that despite the lower imports, China’s copper inventories in bonded warehouses stood at 142,300 tonnes in the week to April 28, up from 50,700 at the end of last year.
The overall message from China’s imports of major commodities is that they are likely to be as uneven and as uncertain as the current economic rebound.
The opinions expressed here are those of the author, a columnist for Reuters.


