Column-Odd bond calm loosening Fed squeeze: Mike Dolan
2023.09.20 02:43

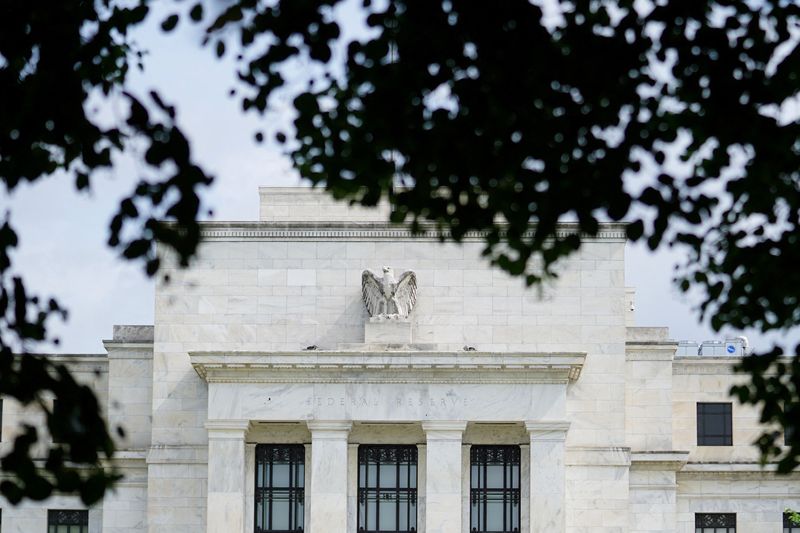
© Reuters. FILE PHOTO: The exterior of the Marriner S. Eccles Federal Reserve Board Building is seen in Washington, D.C., U.S., June 14, 2022. REUTERS/Sarah Silbiger/File Photo
By Mike Dolan
LONDON (Reuters) – An eerie calm in U.S. Treasuries seems at odds with uncertainty about the end of the harshest tightening cycles in decades – but it’s a lifebuoy for wider markets fearful of draining liquidity.
Even though 10-year Treasury yields are clocking 15-year highs, visibility on medium-term growth, inflation, oil prices and government debt is foggy and the Federal Reserve remains coy about the precise end of its 18-month rate squeeze – bond market volatility has plummeted over the past month.
The closely watched MOVE index of implied volatility in U.S. Treasury securities across the maturity spectrum plumbed its lowest level last week since the Fed started hiking rates in March of last year.
And it’s now at least half the seismic peaks hit during the regional banking blowup just six months ago – when sudden fears of a credit crunch, recession and forced Fed reaction sent two-year Treasury yields into a rigor.
Those fears never materialised through the summer months of course. And, for all the “ifs” and “buts” about the timing of peak Fed rates, there has been growing confidence the disinflation process and lagged impact of past rate rises mean the campaign is over bar the shouting.
But can investors really have that much conviction about plain sailing ahead?
Curiously, Bank of America’s monthly fund manager survey showed about two-thirds of asset managers think the Fed is done but more caution was evident in the first net underweight allocation to global bonds in seven months in September.
Fed projections around its presumed policy pause later on Wednesday may lift the clouds a bit, but an angry rebound in energy prices of late and creeping doubts about government spending and foreign demand for Treasuries all suggest stormier seas ahead at least.
And to be fair to the MOVE index – which is derived from pricing in swaps and options markets – it remains well above pre-pandemic levels and a fifth higher than the average of a post-2008 period dominated by the Fed’s quantitative easing.
But aside from a reflection of market risk and hedging, the MOVE may matter more than many think.
Even though most economists focus solely on the actual level of still-rising medium-term borrowing costs as the main gauge of financial conditions, the extent of bond volatility is seen as a key ingredient or magic sauce affecting private markets’ ability to generate cash and liquidity more broadly.
REPO MAN
Liquidity specialist CrossBorder Capital stresses the importance of bond volatility per se to the ebb and flow of global liquidity – a factor catalysing money supply and central bank balance sheets, the supply of high-quality collateral such as government bonds and offshore funding pools.
The gist of its point is that global liquidity sloshing around the world is supercharged by securities repurchase markets – where an investment fund can post high-quality assets such as Treasuries on repo with a broker in return for cash invested elsewhere.
The level of cash raised, or the size of the so-called haircut, is determined by the risk of the asset and its implied volatility over the maturity of the repo.
And that process can get even more complicated through a process wonks call “rehypothecation” – essentially where the broker temporarily holding the paper then repos the same asset to raise cash of its own for a slightly bigger haircut.
Chains like this build and can become extremely fragile – as they did in the credit crunch that followed 2008’s bank crash.
But the essence of the argument is that lower bond volatility ups the amount of cash liquidity flowing around world markets, and vice versa.
As a measure of just how much of that punchbowl is affected, CrossBorder claim their estimate of global liquidity that combines this private credit generation with international flows and central bank money is as much as $170 trillion – almost 10 times central bank balance sheets alone.
But it is the incremental movement in this giant pool that arguably matters most for stock markets and asset prices.
Even though global liquidity is shrinking as you might expect in the face of rising Western interest rates, central bank balance sheet reduction and a higher dollar, other offsets are significant.
One obvious one is that the People’s Bank of China is easing credit now to address its property bust and sputtering domestic economy and is adding to the global liquidity pool as others drain away at the other end.
But even within the United States, CrossBorder claims the pace of liquidity contraction is easing.
Some of that is down to a sharp drop in the amount of money the Fed is forced to drain from the system via its overnight reverse repo facility.
The size of the daily reverse repos, designed to siphon excess liquidity out of the banking and money markets as part of the Fed’s tightening process, fell to its lowest in two years this month, according to New York Fed data.
At about $1.45 trillion, that daily drain has now dropped by more than half a trillion dollars since midyear and is down more than a trillion from the peaks late last year.
But falling bond volatility has likely played a big part in softening the blow too.
“The MOVE affects the collateral multiplier and means that a falling collateral base may still mean higher liquidity when volatility is dropping,” concluded CrossBorder Capital in a note to clients. “The two together have helped overall liquidity conditions – but we are mindful that bond markets are likely to remain volatile and need to be monitored carefully.”
The opinions expressed here are those of the author, a columnist for Reuters.


