Column-Next solar expansion drive needs to hit higher potential markets: Maguire
2022.09.28 03:22
[ad_1]

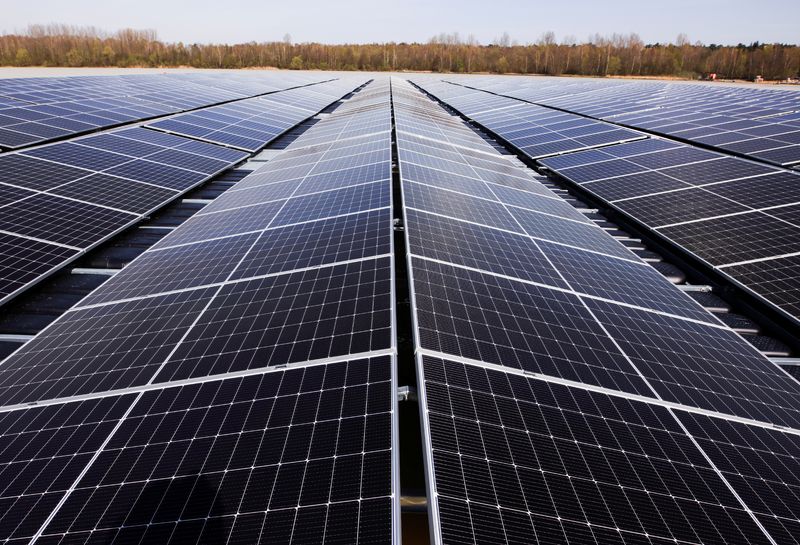
© Reuters. FILE PHOTO: Solar panels are pictured on a floating photovoltaic power plant on lake Silbersee (Lake Silver) in Haltern am See, Germany, April 11, 2022. REUTERS/Thilo Schmuelgen
By Gavin Maguire
LITTLETON, Colo. (Reuters) – Solar power has outpaced wind power over the last five years in terms of global capacity additions, notching up a more than 200% increase in worldwide generation from 2016 to 2021, compared to a 93.5% rise in wind generation during the same slot.
But more than two-thirds of solar’s capacity growth has come within the top five solar producing countries that have long been established leaders in solar development.
China, the United States, Japan, India and Germany together generated 67.4% of all solar power in 2021, and have been among the largest solar power developers for decades.
GRAPHICS: World solar vs wind power production
The problem is, when measured by photovoltaic power potential, or the amount of sunlight available to generate solar power, three of those countries are not even in the top 100 most suitable solar locations.
That means that most global solar production stems from countries that are not that well suited to the technology, and that other locations could be a far better fit for power producers looking to tap the full potential of the sun.
MISMATCH
According to the World Bank’s Global Solar Atlas (NYSE:), which provides a harmonized view of the amount of solar energy available for each country, the highest potential areas for solar power production are mainly in Africa and the Middle East, thanks to year-round sunny conditions.
In contrast, an overwhelming majority of the existing solar power production capacity resides in countries that experience much more intermittent sunshine due to cloudier conditions and reduced daylight hours in the winter.
Graphic: Solar potential vs solar generation map :
This mismatch between where solar plants are actually being developed and the better-suited but underdeveloped potential locations elsewhere provides development agencies and power producers with an opportunity to help non-emitting solar make deeper inroads into energy systems just as worldwide pressure mounts to cap collective emissions.
Beyond boasting abundant sunshine, many high photovoltaic potential countries are also home to quickly-growing economies that generate rapidly expanding pollution levels.
Take Egypt as an example, which ranks fourth on the photovoltaic potential scale, and 30th in terms of global solar power capacity.
Graphics: Solar potential vs solar power generation countries
The country’s economy is on course to grow by over 5% in 2022, and its 110 million population is seeking greater mobility and opportunity in line with the usual development courses charted across the region.
Between 2016 and 2021 the country expanded renewable energy production by nearly 300%, but it still relies on fossil fuels for nearly 90% of its electricity.
Along with that heavy reliance on fossil fuels comes a significant carbon footprint, which according to the BP (NYSE:) Statistical Review of World Energy totalled 267.1 million tonnes of CO2 in 2021, the second highest in Africa after South Africa.
If the country’s emissions trajectory remains the same over the coming decade as it has since 2010, Egypt’s total CO2 emissions will top 300 million tonnes by 2030.
But if instead Egypt’s power sector can maximise the country’s solar potential, then the country could well emerge as a future solar leader that can showcase how favourable solar conditions married with supportive policy frameworks can accelerate decarbonisation efforts without undermining economic growth.
OTHER FRONT RUNNERS
Several other North African nations have a similar growth potential profile to Egypt’s in terms of sunshine availability and fast-growing economies, including Algeria, Morocco and Tunisia.
Countries across the Middle East including Jordan, Saudi Arabia and Oman also have very high photovoltaic suitability and potentially deeper government pockets to underpin national energy system transitions.
But Egypt may still be better able to harness the opportunity, given that the country will play host to the upcoming COP27 United Nations Climate Change conference in November at a hotel that has built a solar plant on its roof to demonstrate the country’s commitment to using cleaner power.
Of course, the one-megawatt plant at the Sharm el-Sheikh hotel is negligible compared to the nearly 66 terawatt-hours of solar power brought online by China alone between 2020 and 2021.
But if it helps redraw the map of significant solar installations it will be a welcome development in the global solar discourse, and may help steer much-needed development resources to locations that could well showcase solar power’s potential even better than the current leaders elsewhere.
[ad_2]
Source link


