Column-Demand weakness helps cushion tin from supply problems: Andy Home
2024.11.04 12:15
By Andy Home
LONDON (Reuters) – Tin demand last year was weaker than expected and is on course for only a modest recovery in 2024, according to the International Tin Association (ITA).
The soldering metal has been the consistent out-performer on the London Metal Exchange (LME) this year. The three-month price traded at $32,250 on Monday, up 27% on the start of January.
But the ITA’s annual survey of tin users shows this year’s price strength has been more about tin’s stressed supply dynamics than the state of demand.
A YEAR OF DECLINE
Refined tin usage contracted by 3.9% year-on-year to 357,100 metric tons in 2023, according to a survey of 80 companies accounting for some 42% of global demand.
This was a much weaker outcome than anticipated this time last year, when surveyed companies expected a relatively mild 1.6% year-on-year dip.
Total tin usage, comprising both refined and unrefined forms of the metal, dropped by an even sharper 4.9% year-on-year to 433,000 metric tons in 2023, the ITA’s provisional estimates showed.
This year will see what the Association termed “a moderate recovery cycle driven by China” with survey participants expecting 3.0% demand growth.
Tin demand from the soldering sector, which represents just over half of total global usage, was 1% lower last year with a cost of living crisis in many Western countries suppressing demand for electronic goods.
This year, tin use in the sector is forecast to rise by 2.5%, helped both by broader economic recovery and the gradual phase-out of lead in circuit-board soldering.
Other major demand drivers fared worse last year with tin usage in chemicals falling by 3.1%, tinplate by 7.6% and alloys by 16.9%. Most are expected to bounce back in 2024 except for the tin-copper segment due to its exposure to China’s struggling construction sector.
STOCKS SURGE
Global demand weakness helps explain why exchange inventory mushroomed over the course of 2023 and the early part of 2024.
Registered stocks held by the LME and the Shanghai Futures Exchange (ShFE) grew from 10,000 tons at the start of last year to almost 25,000 tons in May this year.
Exchange stocks continued to build even as Indonesian exports were suspended over the first two months of 2024 due to permitting delays.
China accounted for most of the stocks increase, ShFE inventory hitting an all-time high of 17,818 tons in May.
Consumers were also holding stocks equivalent to around 3.8 weeks’ worth of global supply at the end of 2023, a ratio that was largely static over the course of the year, the ITA said.
Surveyed companies expect their stocks cover to decrease to 3.4 weeks by the end of this year, reflecting the anticipated bounce in demand.
It is noticeable that since peaking in May Shanghai stocks have fallen back to 8,522 tons, suggesting a tightening of the mainland market.
RAW MATERIALS TIGHTNESS
If, as the ITA survey suggests, China is leading the demand recovery, the impact is being magnified by production problems as Chinese smelters run short of raw materials.
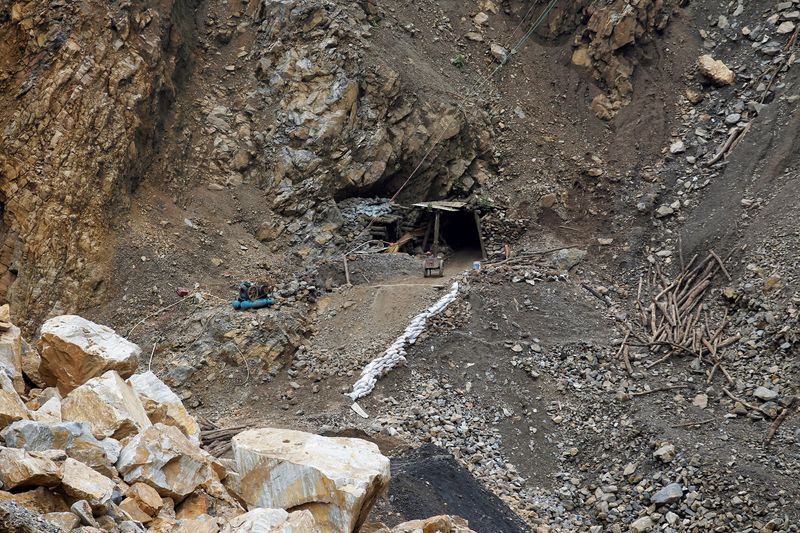
There has still been no update on the status of the Man Maw mine in the semi-autonomous part of Myanmar controlled by the Wa State.
The mine, which accounts for around 7% of global tin output and supplies many Chinese smelters, has been suspended since August of last year, ostensibly for an extensive audit by Wa authorities.
Chinese imports of tin concentrates from Myanmar slowed to a trickle of just 1,400 tons in September. Year-to-date imports from Myanmar have collapsed by 52% to 66,000 tons.
The squeeze is starting to affect China’s tin smelters, particularly in the provinces of Yunnan and Geiju, according to local data provider Shanghai Metal Market, which expects national output to drop in the months ahead.
Chinese buyers are turning to the overseas market for their refined metal. The country imported almost 2,000 tons of refined tin in September, the highest monthly tally since January and enough to turn the country into a net importer for the second consecutive month.
VOLATILITY DAMPENER
The fate of Man Maw is the big known unknown in the tin supply picture right now. It is the reason tin is commanding a scarcity premium over the rest of the base metals complex.
Yet, it is clear that the global demand downturn of 2023 was sufficiently sharp to generate a sizeable stocks build that has helped dampen market volatility.
Until now at least.
Even allowing for a moderate demand recovery this year, the extra pull on units will inevitably add to tin’s supply-chain stress.
China has not managed fully to offset the loss of Myanmar raw materials feed. Total imports of mined concentrates from all sources fell by almost a third in the first nine months of this year.

As Chinese smelters struggle to lift output and the inventory cushion deflates, tin may be in for some turbulence ahead.
The opinions expressed here are those of the author, a columnist for Reuters.


