Column-Beware Egypt’s smokestack onshoring as cement exports surge: Maguire
2025.01.17 01:35
By Gavin Maguire
LITTLETON, Colorado (Reuters) – North Africa’s largest economy and second-largest producer has stepped up the production and export of several highly energy-intensive commodities as part of efforts to accelerate the growth of its industrial sector.
Egypt’s combined exports of cement, fertilizers and chemicals doubled between 2022 and 2024 and have grown by 350% since 2019 thanks to increased government support aimed at spurring rapid industrial expansion.
The higher output in Egypt has emerged just as production of the same commodities has decreased in Europe, and highlights a growing trend in the re-shoring of smokestack sectors away from high energy-cost locations and areas with pollution controls.
The juiced-up output across Egypt’s heavy industry – which also includes refining and natural gas processing – has helped create valuable private-sector jobs in the 112 million population country.
But the climate impact of the sharp swell in output of such energy-intensive and high-polluting products remains an important unknown, due to relatively lax reporting standards compared to parts of Europe, North America and Asia.
EXPORT BOOM
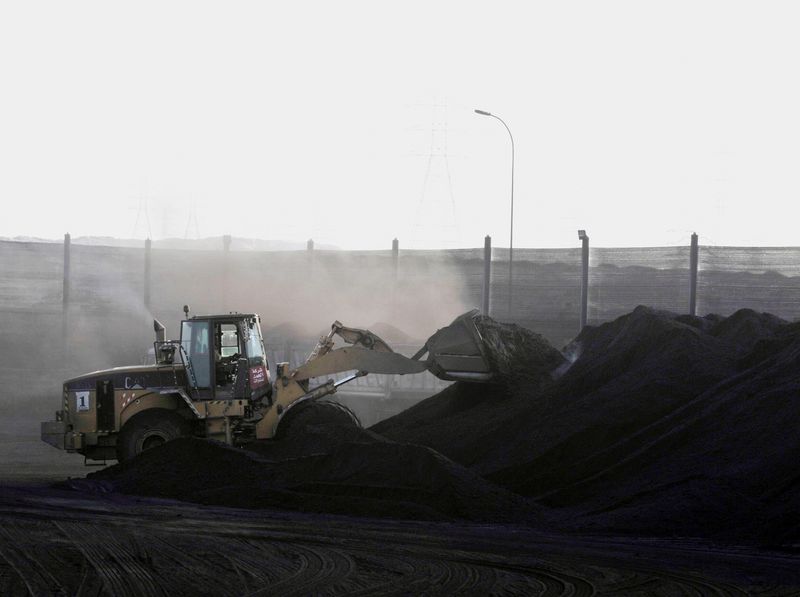
Egypt’s exports of cement and clinker – a raw material used in cement production – were 9.7 million metric tons in 2024, a record volume nearly three times larger than the amount shipped out in 2022, according to ship tracking data from Kpler.
Fertilizer exports from Egypt were also a record in 2024, and showed a 70% jump from 2022 to 8.3 million tons.
Production data on Egypt’s 2024 cement and fertilizer sectors has yet to be released, but in 2023 the country ranked 11th globally with cement output of around 50 million tons, according to World Cement Association data. Egypt ranked sixth for nitrogen fertilizer output (3.5 million tons) in 2023, according to the International Fertilizer Industry Association.
Both the cement and fertilizer sectors have been identified by the Egyptian government as key drivers of economic growth.
To support their continued expansion, they and other industrial sectors have been allocated fixed prices for their natural gas supplies, which help them control costs.
Large government infrastructure projects are also set to spur higher local demand for cement, while the government recently lifted subsidized local prices of fertilizer to help boost margins for fertilizer producers.
The government is also helping sponsor trade missions to several fast-growing regional markets to help drive further sales of its industrial products.
BLIND SPOTS
Due to limited information sharing by power plants, utilities and heavy industry, it is unclear what the emissions toll is from this expansion in Egyptian industrial output.
However, the International Energy Agency estimates that around 0.8 to 0.9 tons of carbon dioxide (CO2) are discharged for each ton of cement production and around 2.6 tons of CO2 are emitted for every ton of nitrogen fertilizer produced.
As a result, Egypt’s hefty industrial commodity production totals are likely to yield a substantial pollution aftermath.
In 2023, Egypt discharged 279 million tons of CO2 from energy production and industrial processes, according to the Energy Institute, the most among North African nations and the 25th largest globally.
That said, the emissions picture is complicated by production changes that are underway among international cement and fertilizer manufacturers who are attempting to boost plant efficiency levels and reduce overall emissions.
Recent shifts within the international operations footprint of Heidelberg (ETR:) Materials are a case in point.
Germany’s largest cement producer halted cement output at its Hanover plant in 2024 due to weak local sales, but at the same time upgraded its Helwan cement facility near Cairo.
Those moves enabled Heidelberg to better align production levels within key markets, by reducing output in shrinking markets while expanding production in growth areas.
However, the production changes also opened the company to accusations of relocating high-polluting operations out of the Eurozone – where emissions standards are becoming stricter – to areas where pollution standards are potentially more lax.
The actual resulting emissions impact of these shifts are yet to be reported, but data on Heidelberg’s overall emissions footprint indicate that the company has steadily reduced its CO2 discharge, from around 73 million tons in 2019 to 63.2 million tons in 2023, according to LSEG.
And the upgrades made to Heidelberg’s Helwan plant include a new waste heat recovery system that is expected to reduce both energy use and discharge levels.
Of course, Heidelberg is just one of many cement producers with operations in Egypt, and other firms may have different emissions and efficiency standards.

But the dynamic shifts underway across Egypt’s industrial landscape highlight an important new climate risk stemming from the rapidly growing scale of industrial output in North Africa, even as the heft of those same sectors shrinks elsewhere.
The opinions expressed here are those of the author, a market analyst for Reuters.


