Can US Stocks Keep Outperforming Amid Sky-High Valuations? History Says Yes
2024.06.24 05:47
- Currently, the stock market is a mixed bag: signs point to both a potential correction and a continuation of the bull run.
- We’ll explore the positive forces like central bank pivots and tech advancements, along with reasons for caution like valuations, market breadth.
- Despite these concerns, the US market remains a global leader in performance.
- InvestingPro Summer Sale is on: Check out our massive discounts on our subscription plans – limited time only!
The stock market is currently at a crossroads. Factors that could trigger a correction are present, yet signs also point to a possible continuation of the bullish trend.
There may be valuation and market breadth concerns, but one thing is for sure, US stocks have outperformed globally and look set to continue.
In this article, we will delve into the contrasting forces trying to dominate sentiment with US indexes near record highs.
Potential Tailwinds for US stocks
- Central bank pivot: The European Central Bank has already lowered interest rates, and the Federal Reserve is expected to follow suit later on this year.
- Tech-driven productivity: Technological advancements, especially in AI, are driving innovation and potentially increasing corporate profits.
- Surpassing expectations: Companies are consistently exceeding market forecasts for their financial results, indicating strong business performance.
- Investor optimism: Mutual fund cash levels are at a three-year low, and Bank of America reports a surge in bullish sentiment among fund managers. These trends suggest investors are eager to deploy capital.
- Historical performance: When the experiences a significant annual rise (like 2023’s 24.2% gain), the following year often sees a continuation of the rally. Statistics show this has happened 16 out of the last 20 times, with an average return of 10%.
A Word of Caution
While the overall picture seems optimistic, there are potential areas of concern:
The dominance of a few heavyweight companies is evident. The market capitalization of the 30 largest companies in the S&P 500 now represents nearly 53% of the index, significantly higher than the historical average of around 40%.
Here’s how that compares to history:
- Today: 52.98%.
- 5 years ago: 41.79%.
- 10 years ago: 36.47%.
- 15 years ago: 41.89%.
- 20 years ago: 41.11%.
- 25 years ago: 42.18%.
Today, the top three companies—Microsoft (NASDAQ:), Apple (NASDAQ:), and Nvidia (NASDAQ:)—account for more than 20% of the total market capitalization, compared to just 9% for the top three in 1999.
S&P 500 Vs. S&P 500 Equal Weight
The dominance of large-cap stocks is further highlighted by comparing the classic S&P 500 to the S&P 500 Equal Weight ETF (NYSE:). In the traditional index, larger companies have a greater influence on the overall performance.
The chart below clearly demonstrates the outperformance of the classic S&P 500 in 2023 and 2024, reflecting the strength of these heavyweight stocks.
Despite Everything, US Stock Market Remains a Global Leader in Terms of Performance
The US stock market has been on a tear, consistently surpassing the performance of its global counterparts. This trend isn’t exactly breaking news, but it’s worth highlighting just how dominant American equities have been.
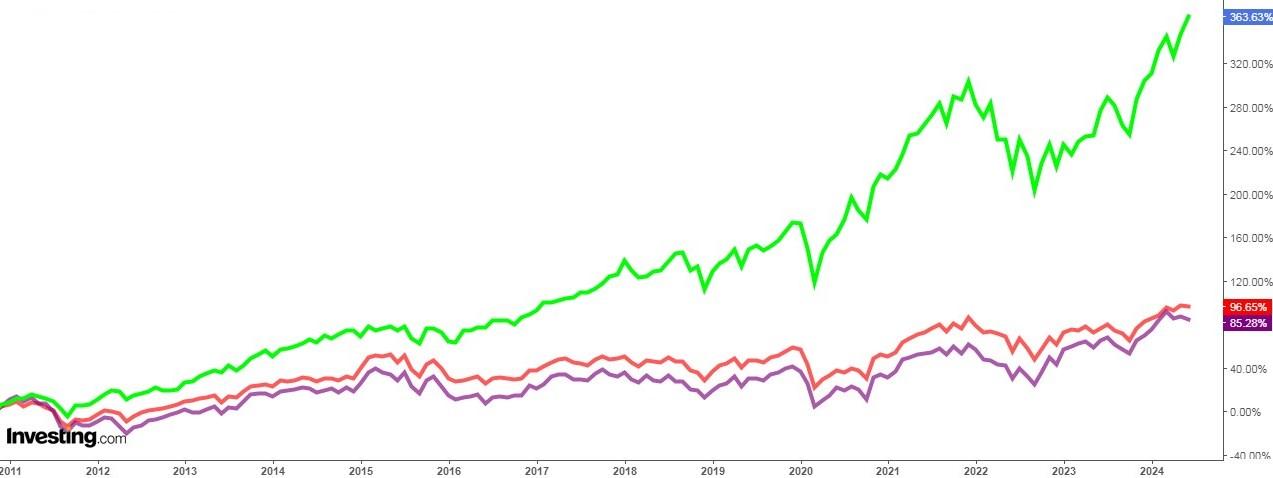
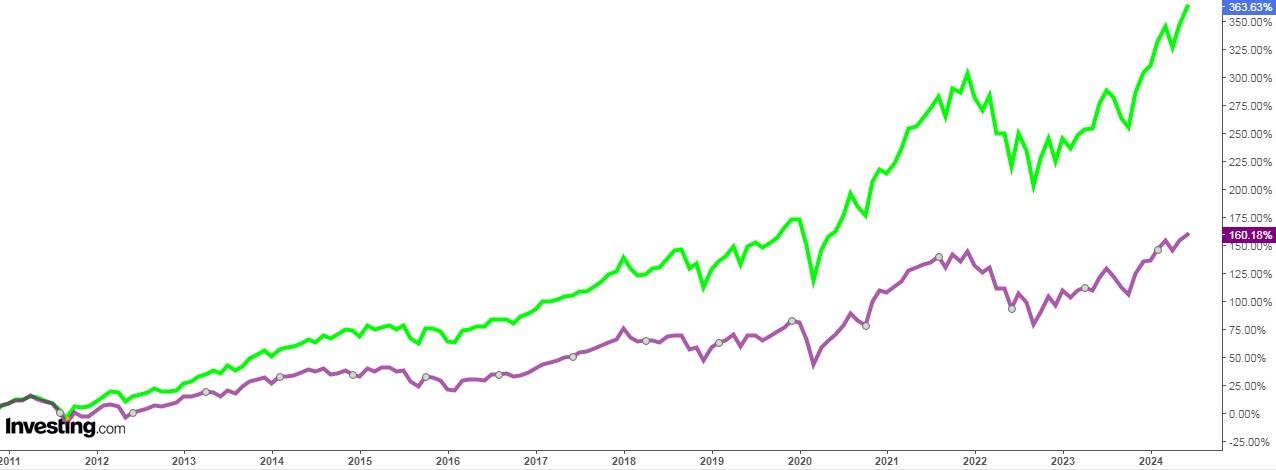
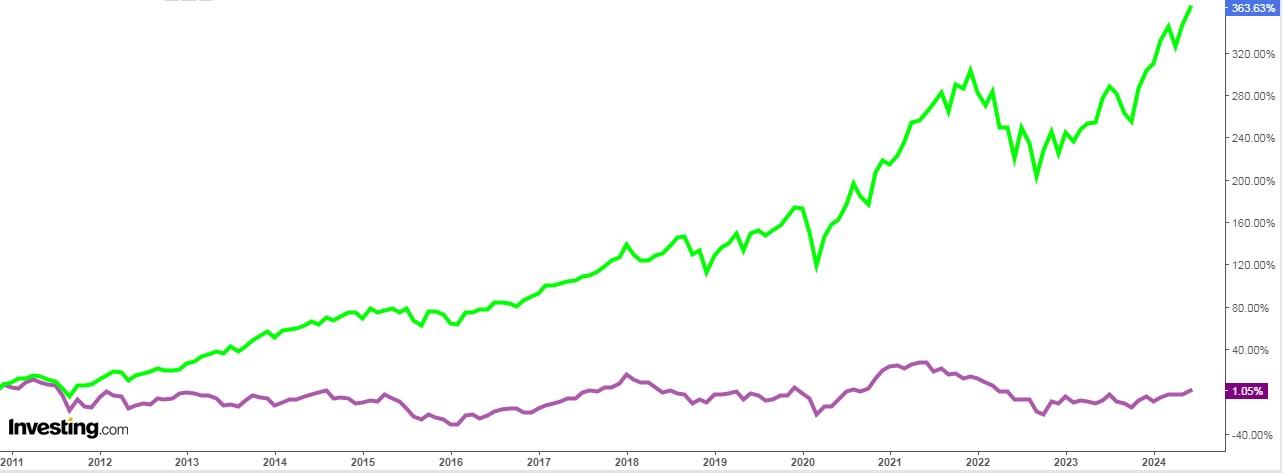
Here’s the data to back it up: Over the past 16 years, the S&P 500, a key benchmark for US stocks, has skyrocketed by a staggering 457%.
That’s significantly higher than the 96% return for global stock markets (represented by the ) and a mere 48% for emerging markets (represented by the ).
Here you can see the comparison between the S&P 500, the and the Europe since 2011.

Here is the S&P 500 versus the MSCI Word index.

And here is the S&P 500’s performance compared to the MSCI emerging markets index.

This outperformance by the U.S. market isn’t just a recent phenomenon. It represents the longest sustained period of dominance we’ve ever witnessed.
This extended period of strong performance raises questions about prospects, but that’s a topic for another discussion. For now, the evidence is clear: the U.S. stock market has been a champion for investors seeking long-term growth.
Investor Sentiment (AAII)
Bullish sentiment, i.e. expectations that stock prices will rise over the next six months is at 44.4%, above its historical average of 37.5%.
Bearish sentiment, i.e. expectations that stock prices will fall over the next six months is at 22.5%, below its historical average of 31%.
***
Access first-hand market data, factors affecting stocks, and comprehensive analysis. Take advantage of this opportunity by visiting the link and unlocking the potential of InvestingPro to enhance your investment decisions.
And now, you can purchase the subscription at a fraction of the regular price. So, get ready to boost your investment strategy with our exclusive summer discounts!
Enjoy incredible discounts on our subscription plans as our annual subscription now costs less than $7 a month!
Don’t miss this limited-time opportunity to access cutting-edge tools, real-time market analysis, and expert opinions.
Join InvestingPro today and unleash your investment potential. Hurry, the Summer Sale won’t last forever!
Disclaimer: This article is written for informational purposes only; it does not constitute a solicitation, offer, advice, counsel or recommendation to invest as such it is not intended to incentivize the purchase of assets in any way. I would like to remind you that any type of asset, is evaluated from multiple perspectives and is highly risky and therefore, any investment decision and the associated risk remains with the investor.


