Can H1 Winners Keep Rallying or Is a Correction in the Offing?
2023.07.06 07:17
- Nvidia, Meta, and Carnival stocks have been star performers in H1 2023
- As H2 commences, could these stocks maintain the momentum, or is a steep correction likely?
- Using InvestingPro, let’s delve deeper to find out
- InvestingPro Summer Sale is back on: Check out our massive discounts on subscription plans!
The had an impressive first half of 2023, recording a solid gain of 15.8%. The primary driving force behind this performance has been and continues to be the booming artificial intelligence (AI) industry.
Notably, Nvidia (NASDAQ:), the undisputed leader in this sector, experienced remarkable growth, with its stock surging by 190% during the first half of 2023, up until yesterday’s session. Following Nvidia, Meta (NASDAQ:) saw a significant increase of 145%, while Carnival Corporation (NYSE:), despite a weak period in 2020-2022, pleasantly surprised with a rise of 138%.
However, it’s important to acknowledge that all the mentioned companies face a high risk of correction, which could potentially occur as a natural unwinding after a period of rapid growth rather than a complete reversal.
Specifically, there is a significant risk of a correction in Nvidia’s shares. Much has been written about the factors contributing to the recent surge in Nvidia’s stock price. Nevertheless, it’s worth considering the geopolitical context, as the trade war between China and the U.S. intensifies with additional sanctions on China, particularly in the semiconductor industry.
These sanctions may significantly impact Nvidia’s export of products to China, which has been a critical revenue-generating market alongside Taiwan and the U.S. If the sanctions prove effective, it could pose a serious challenge for the U.S. chipmaker.
Furthermore, the fair value index suggests a risk of correction, with the possibility of a drop of more than 30%.
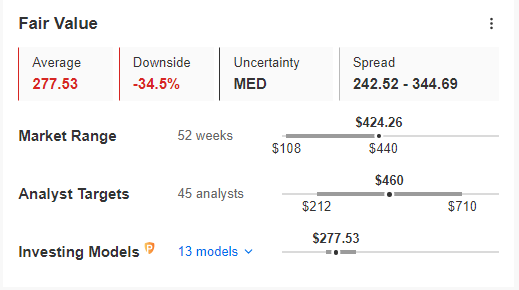
Nvidia Fair Value
Source: InvestingPro
The target level indicated for a correction appears to represent the most pessimistic scenario, considering that the first signs of trouble on the supply side may arise around the $350 region, coinciding with a significant support area.
This level holds importance as it has historically acted as a key support level for the stock.
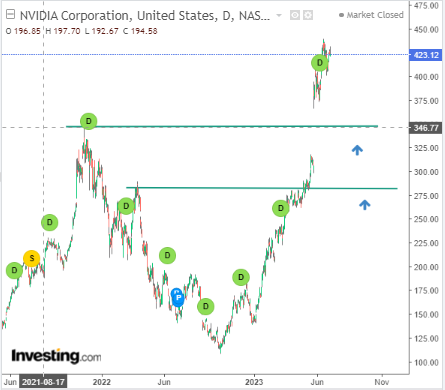
Nvidia Daily Chart
Will Threads Be a Serious Competitor to Twitter?
This week marks the highly anticipated entry of Threads, Twitter’s major competitor, into the social media market. Meta, formerly known as Facebook, stands a good chance of capturing a significant market share, particularly among users dissatisfied with Elon Musk’s platform and seeking an alternative online space.
However, internet users in the European Union will face disappointment, as legal disputes between the EU and Meta will prevent the platform from being available in Europe for the time being. Nevertheless, the launch of this new platform is boosting Meta’s stock price. If the platform experiences substantial user growth, it could be a strong foundation for maintaining an upward trend in the company’s performance throughout the year’s second half.
Meta’s net profit and earnings per share forecasts appear promising compared to its competition, suggesting positive financial prospects for the company.
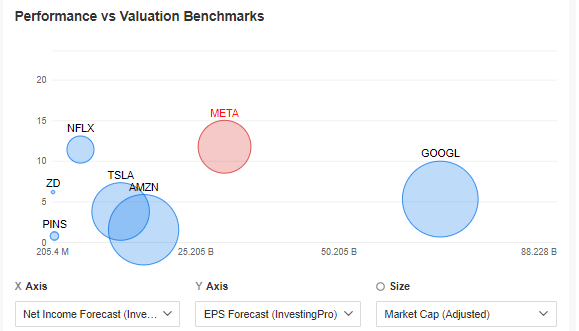
Meta Vs. Peers
Source: InvestingPro
Waiting for a correction can be a classic strategy in this situation. By patiently anticipating a pullback in the market, investors may have the opportunity to enter at a more favorable price.
This approach allows for potential participation in the upward trend toward historical highs while optimizing the risk-reward ratio.
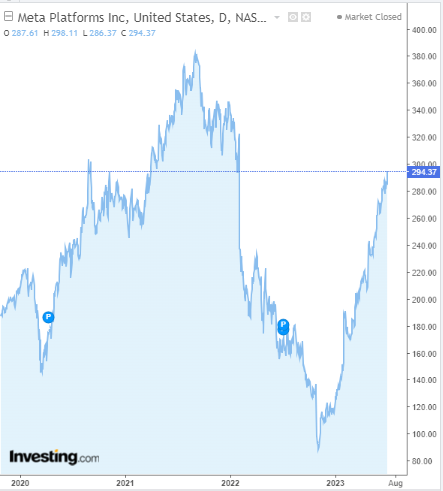
Meta Daily Chart
Carnival’s Resurgence Takes the Stock to Its Highest Levels Until April 2022
Carnival Corporation is a multinational company operating in the cruise ship industry, with a presence in the United States, the United Kingdom, and Panama. The company has faced substantial challenges due to the impact of the pandemic, which resulted in a significant decline in customer demand due to restrictions and lockdown measures.
Due to this challenging period, Carnival’s debt levels reached a peak of $32 billion. This increase in debt can be observed, among other indicators, through the debt-to-capital ratio, which reflects the proportion of debt in relation to the company’s total capital structure.
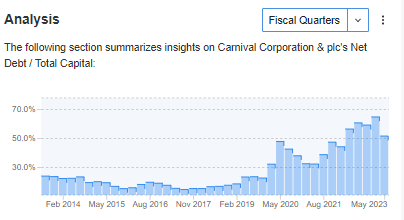
Debt to Capital Ratio
Source: InvestingPro
Carnival has been actively reducing its net losses since 2020, instilling hope for a sustained rebound and a gradual reduction of its relatively high debt. The company’s recovery in the year’s first half is encouraging, indicating positive momentum toward improving its financial situation.
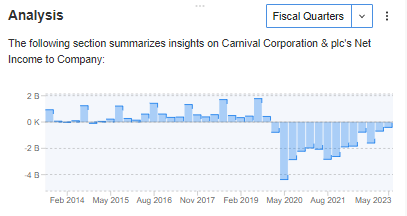
Net Income to Company
Source: InvestingPro
The upcoming months will be crucial for Carnival. It will be important for the company to maintain customer growth and profitability to sustain the positive trend that began in early May. If they can achieve this, it will contribute to the ongoing recovery and the company’s stock performance. They will focus on attracting more customers and generating profits during this period.
Access first-hand market data, factors affecting stocks, and comprehensive analysis. Take advantage of this opportunity by visiting the link and unlocking the potential of InvestingPro to enhance your investment decisions.
And now, you can purchase the subscription at a fraction of the regular price. Our exclusive summer discount sale has been extended!
InvestingPro is back on sale!
Enjoy incredible discounts on our subscription plans:
- Monthly: Save 20% and get the flexibility of a month-to-month subscription.
- Annual: Save an amazing 50% and secure your financial future with a full year of InvestingPro at an unbeatable price.
- Bi-Annual (Web Special): Save an amazing 52% and maximize your profits with our exclusive web offer.
Don’t miss this limited-time opportunity to access cutting-edge tools, real-time market analysis, and expert opinions.
Join InvestingPro today and unleash your investment potential. Hurry, the Summer Sale won’t last forever!
 Summer Sale Is Live Again!
Disclaimer: This article was written for informational purposes only; it does not constitute a solicitation, offer, advice, counsel, or recommendation to invest, nor is it intended to encourage the purchase of assets in any way.


