Can 2023’s High-Flying Stocks Keep Climbing in the Year Ahead?
2023.12.26 05:34
- Some stocks blazed a trail with their fiery rallies in 2023.
- As the broader market looks to end 2023 on a high, investors are considering what 2024 might bring for these stocks.
- In this piece, we’ll take a look at the 2024 EPS and revenue estimates for these 2023 winners.
- Looking to beat the market in 2024? Let our AI-powered ProPicks do the leg work for you, and never miss another bull market again. Learn more here.
As the year concludes, the stock market is poised to end on a bullish note.
Expectations for a rise in stocks over the next 6 months have surged to 52.9%, marking the highest level since April 15, 2021 (53.8%), and this number has consistently remained above its historical average of 37.5% for a while now.
Meanwhile, equity ETFs saw $69 billion come in this December, making it the best month of inflows in two years. One of the ETFs that received the most inflows was the .
Monday turned out to be the best weekday this year. The averaged a +0.27% gain on Mondays in 2023, with gains 75.6% of the time.
Since 1953, when the New York Stock Exchange adopted the current five-day trading week, there has never been a year in which the S&P 500 closed higher on Mondays more often.
But 2023 is almost history and it’s time to focus on 2024. To that end, let’s take a look at the best stocks based on returns in 2023 and what we can expect from them heading into 2024.
Nvidia
Nvidia (NASDAQ:) designs graphics processing units (GPUs) and chips, it is a world leader in artificial intelligence hardware and software.
Its professional line of GPUs is used for applications in fields such as architecture, engineering and construction, media and entertainment, automotive, scientific research, and manufacturing design.
It was incorporated in 1993 and is headquartered in Santa Clara, California.
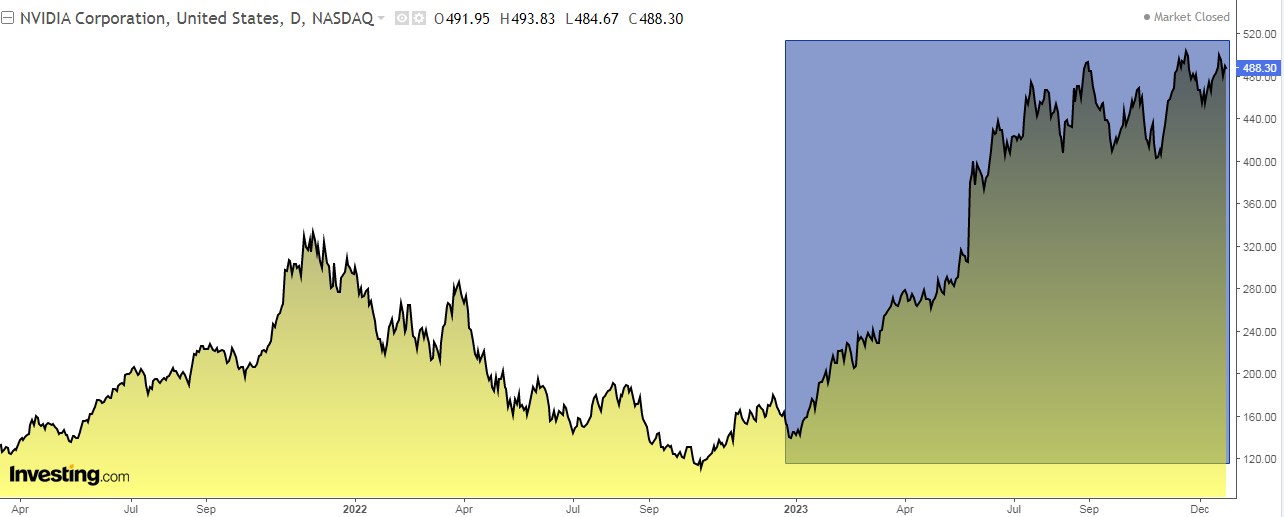
On February 21, it presents its results. For 2024 the forecast is for a +268% increase in earnings per share and +117.5% in actual revenues.
In 2023, its shares are up +234%. Looking ahead to 2024 the market gives it potential at $650 from the current $488.
Meta Platforms
Meta Platforms (NASDAQ:) was incorporated in 2004 and is headquartered in Menlo Park, California.
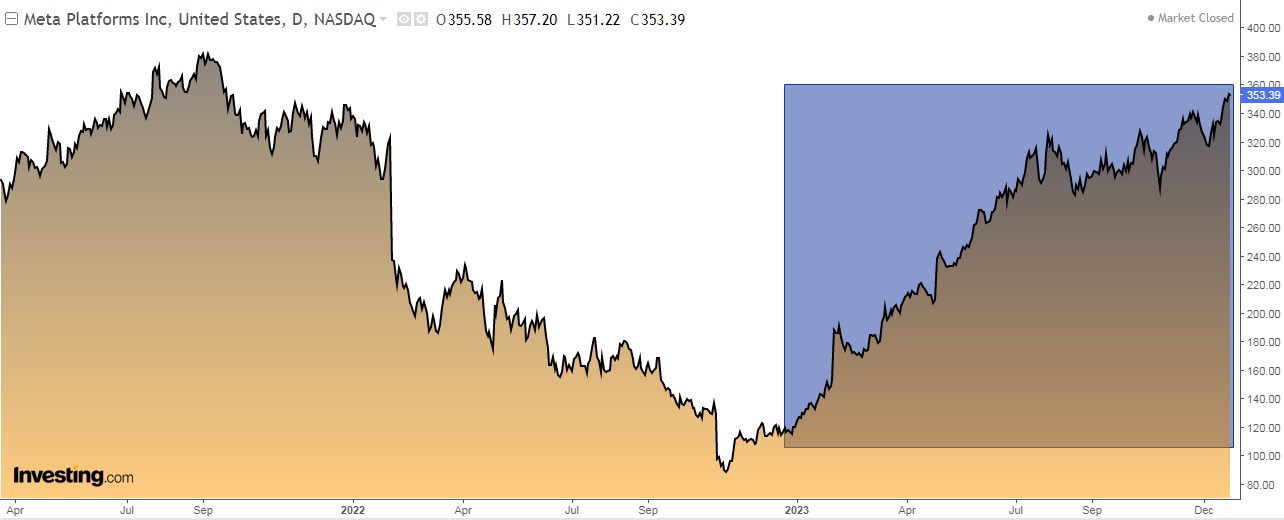
On January 31 we will get the earnings report. For 2024 the forecast is for a +20.5% increase in earnings per share and +13% in actual revenue.
In 2023, the stock is up +193% so far. Looking ahead to 2024 the market gives it potential at $650 from the current $353.
Royal Caribbean Cruises
Royal Caribbean Cruises (NYSE:) is a global cruise company that operates under the Royal Caribbean International, Celebrity Cruises, and Silversea Cruises brands.
The company was founded in 1968 and is headquartered in Miami, Florida.
 Royal Caribbean Cruises Stock Price Chart
On February 1 it publishes its numbers for the quarter. For 2024 the forecast is for a +38.1% increase in earnings per share.
In 2023 its shares are up +159%. Looking ahead to 2024 the market does not consider it an interesting option as it trades above its target price.
Carnival
Carnival (NYSE:) is engaged in the provision of leisure travel services. The company operates in the United States, Canada, Europe, Australia, New Zealand and Asia. It was founded in 1972 and is headquartered in Miami, Florida.
Its quarterly results are due on March 21. For 2024 the forecast is for a +1,746% increase in earnings per share and +14.3% in actual revenues.
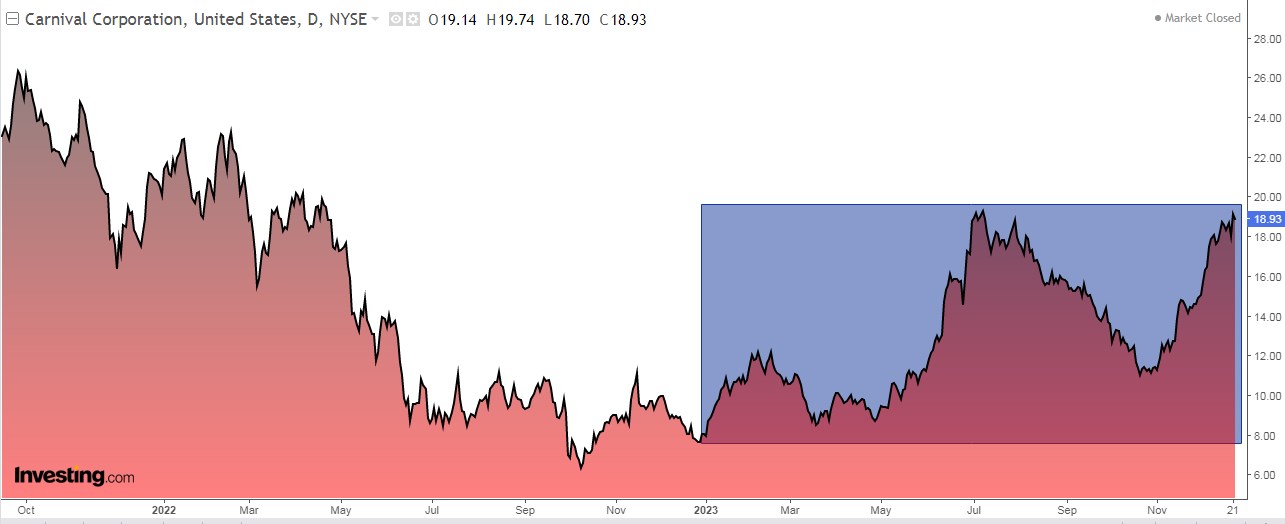 Carnival Corporation Stock Price Chart
In 2023, its shares are up +134%. Looking ahead to 2024 the market gives it potential at $19.22 from the current $18.93, indicating limited upside for the stock.
Broadcom
Broadcom (NASDAQ:) designs, develops, and supplies various semiconductor devices and operates in two segments: semiconductor solutions and infrastructure software.
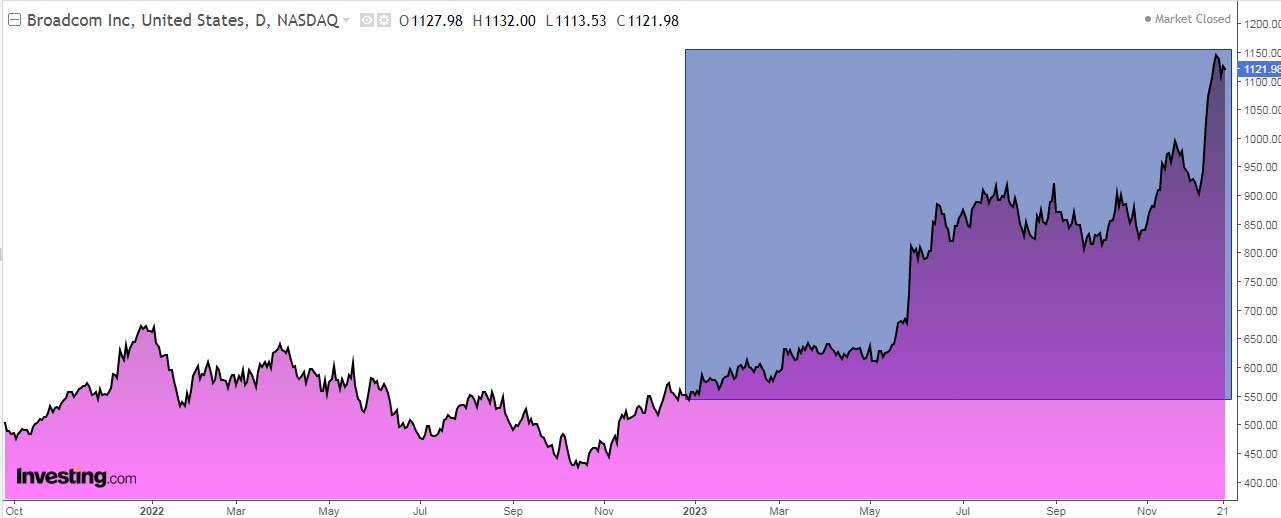 Broadcom Stock Price Chart
Its products are used in a variety of applications, including enterprise and data center networks, home connectivity, broadband access, telecommunications equipment, and smartphones. It was founded in 1961 and is headquartered in Palo Alto, California.
Its results are due on February 29. For 2024 the forecast is for an increase of +11.3% in earnings per share and +38.8% in real income.
In 2023, its shares rose by +100%. Looking ahead to 2024 the market does not consider it an interesting option as it trades above its target price of $1069.
PulteGroup
PulteGroup (NYSE:) is primarily engaged in the homebuilding business in the United States.
It acquires and develops land primarily for residential purposes and builds homes on that land. It was founded in 1950 and is headquartered in Atlanta, Georgia.
On January 30 we will have its income statements. For 2024 the forecast is for a -0.7% drop in earnings per share and a +1.8% rise in real income.
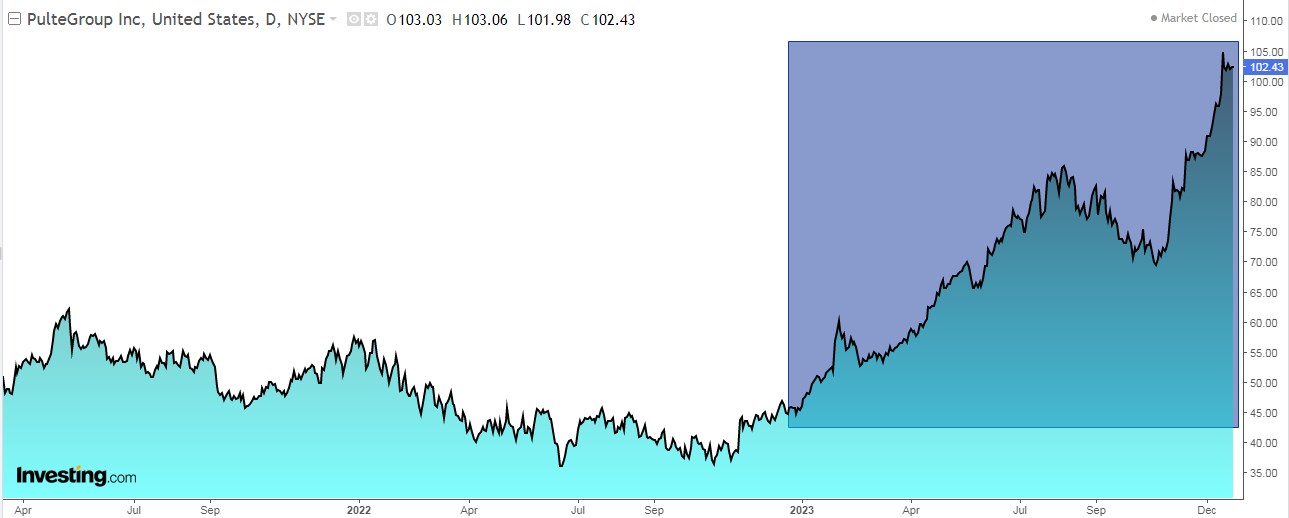 PulteGroup Stock Price Chart
In 2023, its shares are up +112%. Looking ahead to 2024 the market gives it potential at $124.50 from the current $102.43.
***
In 2024, let hard decisions become easy with our AI-powered stock-picking tool.
Have you ever found yourself faced with the question: which stock should I buy next?
Luckily, this feeling is long gone for ProPicks users. Using state-of-the-art AI technology, ProPicks provides six market-beating stock-picking strategies, including the flagship “Tech Titans,” which outperformed the market by 670% over the last decade.
Join now for up to 50% off and never miss another bull market by not knowing which stocks to buy!

Claim Your Discount Today!
Disclosure: The author holds no positions in any of the securities mentioned.


