Build a Recession-Proof Portfolio With the ‘I Dream of Dividends’ Strategy
2023.11.04 04:20
- InvestingPro is a robust platform for conducting comprehensive fundamental analyses using a versatile stock scanner offering diverse financial indicators.
- In this article, we will learn about the ‘I Dream of Dividends’ strategy, tailored to select companies with substantial dividends, high return on invested capital, and efficient capital utilization.
- This strategy employs specific criteria such as dividend yield, return on invested capital, P/E ratio, and income to identify companies suitable for investors during economic downturns.
InvestingPro offers a sophisticated platform for conducting comprehensive fundamental analyses of companies worldwide. Among its array of functions, the stock scanner stands out, allowing users to select companies using a wide variety of financial indicators.
Furthermore, the platform provides pre-designed strategies tailored to cater to the diverse needs of investors. One such strategy is the “I Dream of Dividends,” designed to identify companies offering both substantial dividends and a relatively high level of income and return on invested capital.
This particular selection approach often leads to the inclusion of robust and well-established defensive brands in the market. These companies can serve as valuable additions to investors’ portfolios during economic downturns, potentially offering opportunities in a market characterized by stock price discounts.
Here’s how you can harness the power of the strategy on InvestingPro:
Locate the ‘I Dream of Dividends’ strategy on InvestingPro
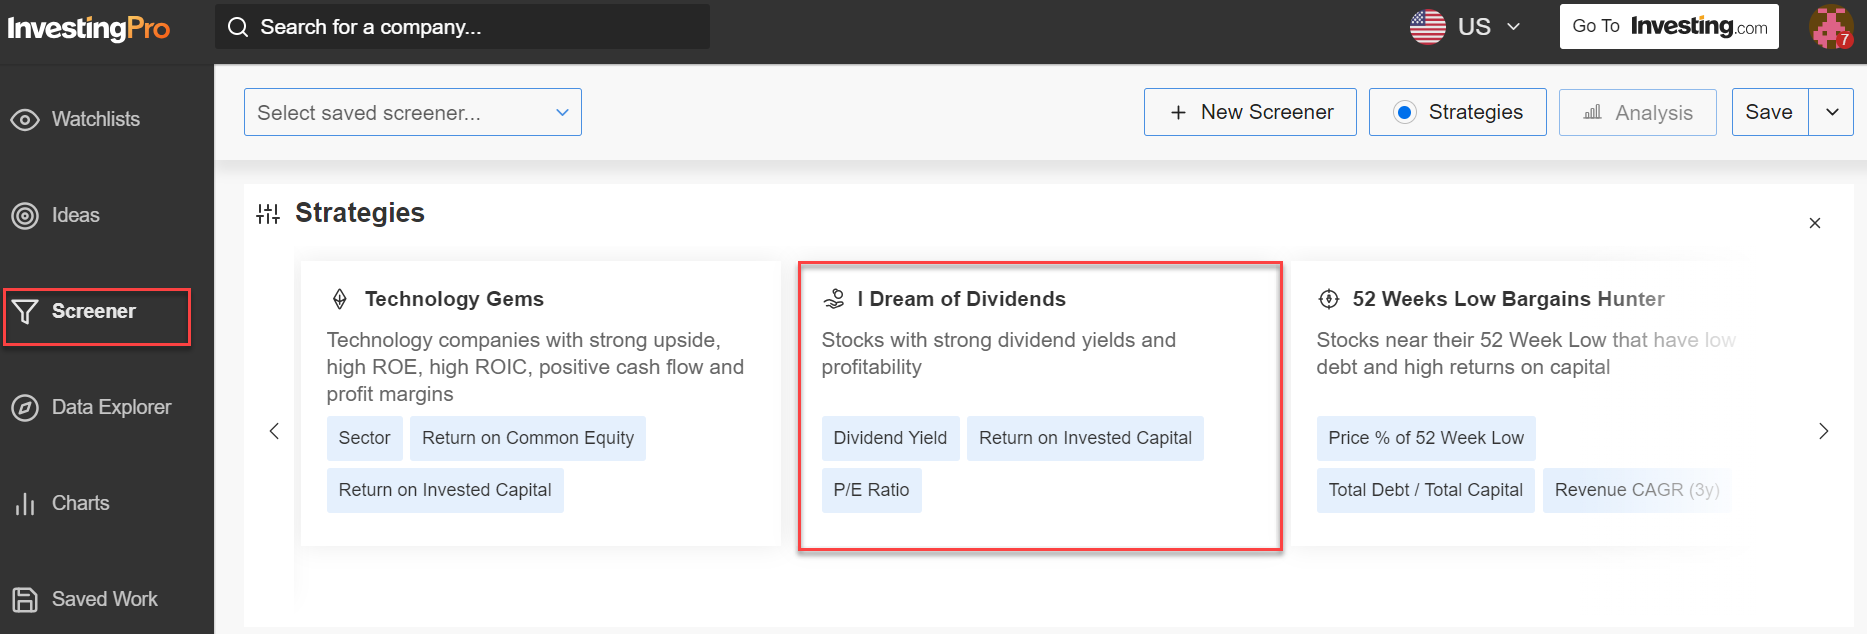
Simply go to the scanner section, then scroll within the available strategies and select the ‘I Dream of Dividends’ strategy we discussed in this article. I Dream of Dividend: InvestingPro
Source: InvestingPro
What exactly Is the ‘I Dream of Dividends’ strategy?
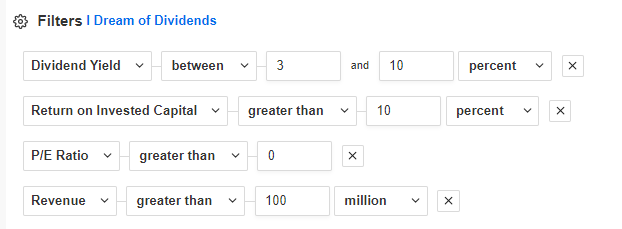
The described “I Dream of Dividends” strategy relies on four key criteria for selecting specific companies:
- Dividend Yield: This fundamental indicator targets companies with a dividend yield ranging from 3% to 10%. The dividend yield ratio is calculated by dividing the value of dividends paid per share by the share price. A higher yield is favored as it signifies greater potential profits for shareholders, demonstrating the company’s commitment to sharing earnings.
- Return on Invested Capital (ROIC): Efficiency in generating returns on invested capital is crucial. A ROIC criterion of over 10% is applied to identify companies capable of achieving investment yields higher than the sector average. This is especially significant for larger, capital-intensive firms, particularly those in the manufacturing sector.
- P/E Ratio: To filter out companies, this strategy uses the price-to-earnings (P/E) ratio. It is intended to exclude companies with negative P/E ratios. While a lower P/E ratio can suggest relatively attractive share prices, it may also indicate troubled companies facing downward stock trends. To avoid overvalued stocks, an upper limit filter based on sector averages can also be added.
- Income: This criterion is used to exclude smaller companies that may not have a consistent track record of long-term dividend payments compared to larger, more capitalized companies. Additionally, the duration of continuous dividend payments by a company is considered. Longer track records increase the likelihood of dividend payments continuing in the future.

Filters
Source: InvestingPro
For potential modifications or additional criteria, you could consider indicators like net income, market capitalization, or price-to-book (P/B) value. However, it’s essential to strike a balance when adding criteria.
Being overly restrictive can limit the pool of eligible companies, so careful consideration should be given to how additional criteria may affect the selection process.
InvestingPro’s crystal clear data presentation to pick your winners
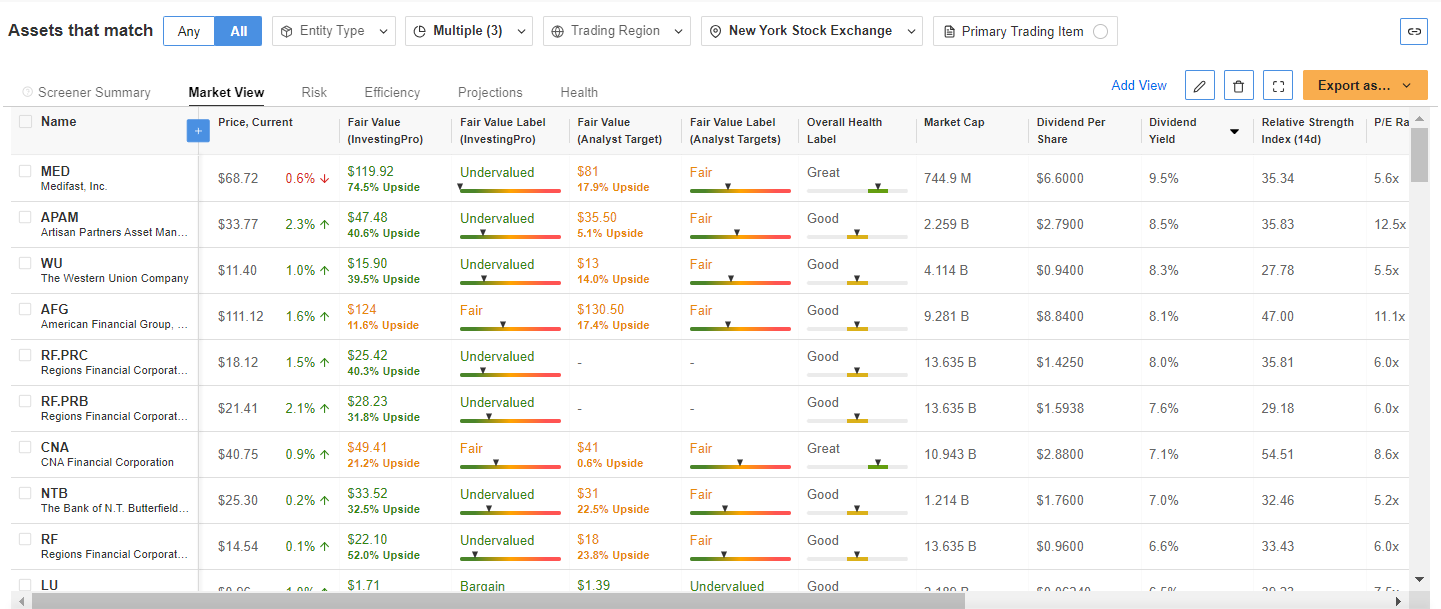
Once the selection process is completed, the InvestingPro tool presents the chosen companies in a tabular format, listing those that meet the established criteria within the specified geographic region.
 Source: InvestingPro
Notably, one standout indicator among the many available is the “fair value.” This metric, determined through a combination of diverse financial models and analyst recommendations, offers insights into whether a company is overvalued or undervalued, often with a specific target price provided.
Moreover, to simplify the process and accommodate users of all levels, the scanner categorizes the vast amount of data into six fundamental categories, as illustrated below:

Data Category
This user-friendly breakdown ensures that even novice traders can readily engage in fundamental analysis, leveraging the capabilities offered by the InvestingPro tool.
***
With InvestingPro, you can conveniently access a single-page view of complete and comprehensive information about different companies all in one place, eliminating the need to gather data from multiple sources and saving you time and effort.
Start your free trial today!

Find All the Info You Need on InvestingPro!
Disclaimer: This article is written for informational purposes only; it does not constitute a solicitation, offer, advice or recommendation to invest as such and is in no way intended to encourage the purchase of assets. I would like to remind you that any type of asset, is evaluated from multiple points of view and is highly risky and therefore, any investment decision and associated risk remains with the investor.


