Beware, S&P 500 investors: This does not look so good!
2022.12.06 04:51
[ad_1]
Beware, S&P 500 investors: This does not look so good!
Investing.com – Contrary to expectations, the has been able to recover strongly since mid-October. Until yesterday’s correction movement, the leading US index even rose by around 17.7% from the yearly lows. So, the question is whether this is already the beginning of a new bull market or whether the bears are returning with full force.
Given the numerous challenges that lie ahead for market participants, this question cannot be answered easily.
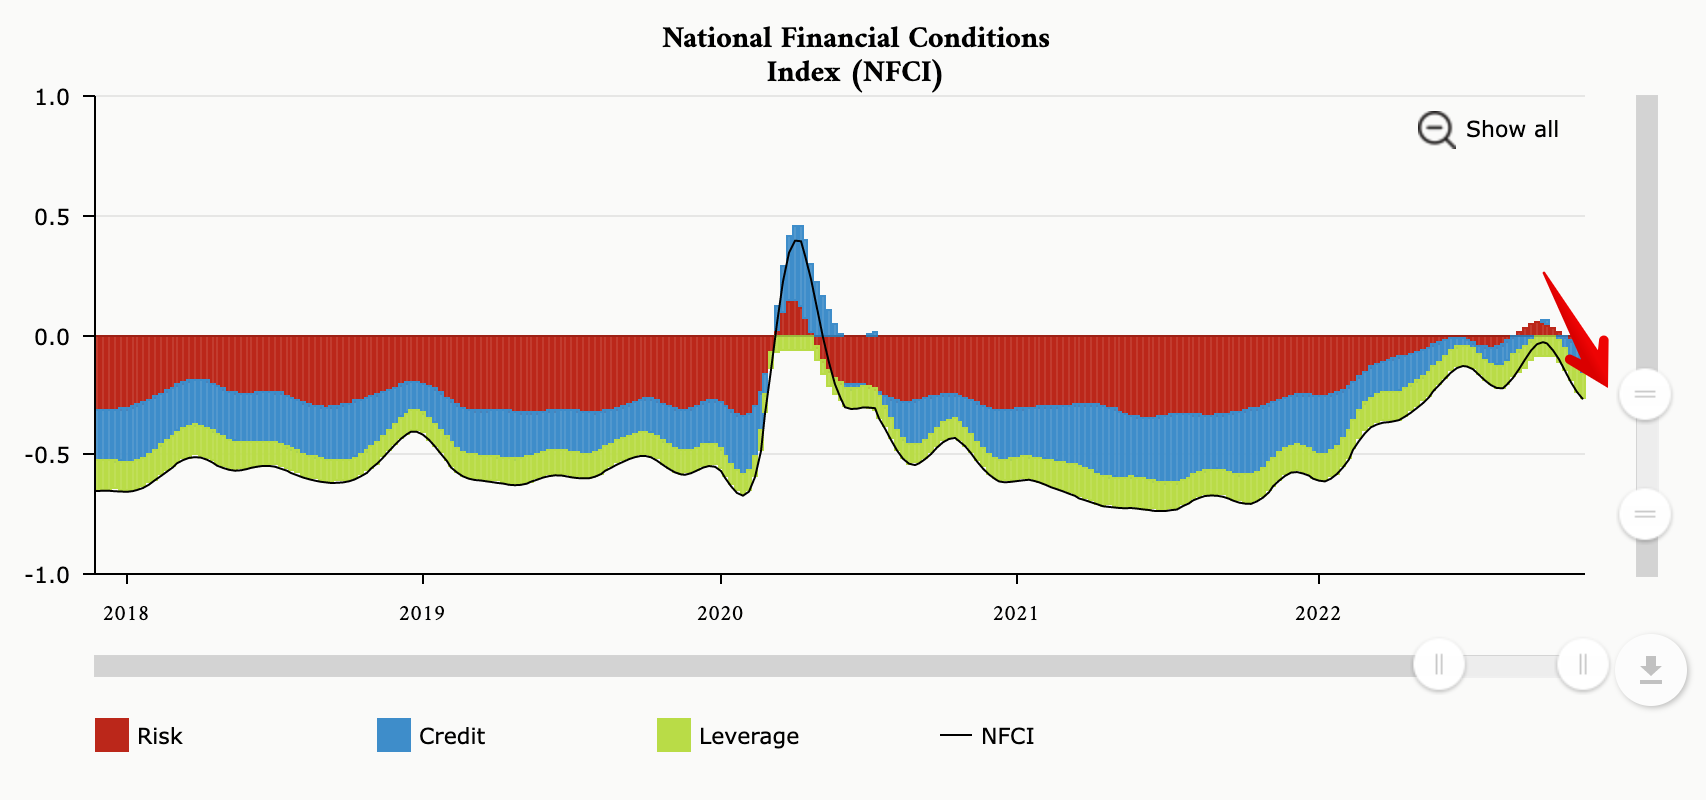
With the recent stock market rally, financial conditions have eased dramatically again – a warning signal, after all, the Fed wants to tighten conditions to curb the highest in forty years.
The Federal Reserve’s National Financial Conditions Index, or NFCI, recently fell to -0.27, its lowest level since mid-May. Readings above zero indicate a tight financial environment by historical standards. A friendly financial environment is indicated by the NFCI from values below zero. The stress index provides information on the current situation in the U.S. equity, money, and bond markets as well as in the shadow banking system.
Source: Chicago Fed
The recent recovery rally was instead the result of market participants’ great relief at the fact that the Fed is taking its foot off the interest rate pedal for the time being and an end to the rate hike cycle is in sight. Although recently said that it was time to slow the pace of rate hikes, his statement remains valid after the latest : according to it, the Fed may have to raise rates much further than assumed in the central bankers’ dot plots in September, he said at the time.
The reasons are: financial conditions have already visibly eased, the labor market continues to run smoothly (see the November ), and globalization is being rolled back to some extent (tensions with China and Russia, anti-inflation law in the US). The big unknown is , which could pick up with China reopening, which would give inflation an unwanted boost.
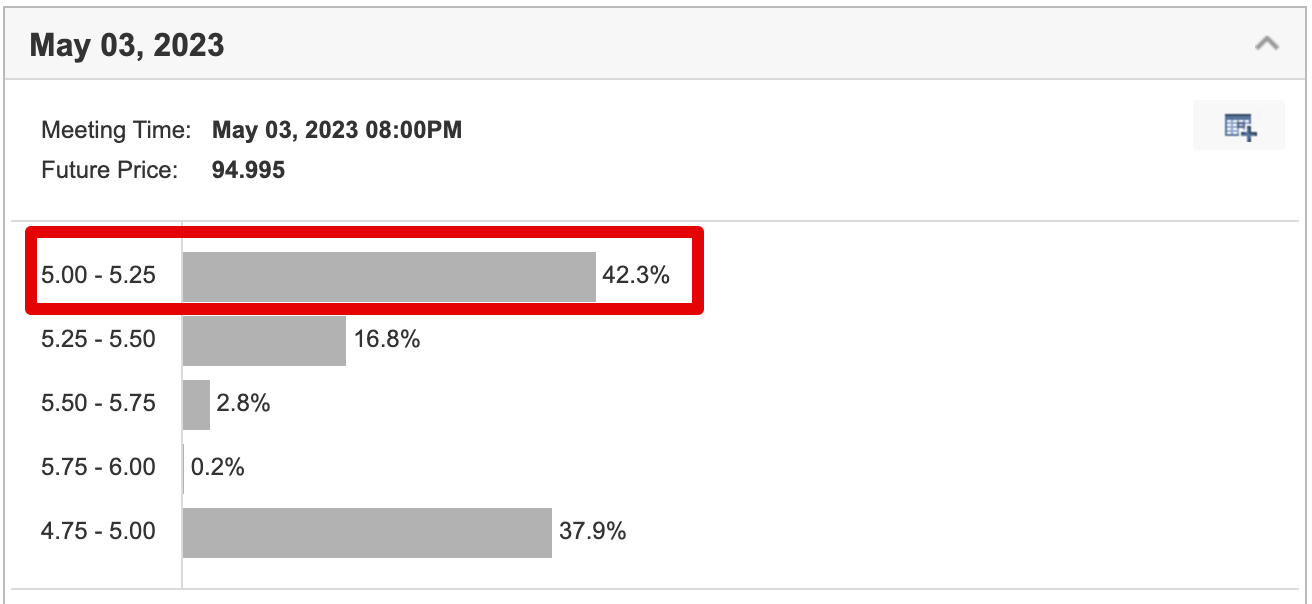
Currently, market participants see the May 2023 interest rate peak at . This is the range to keep an eye on in the next from Fed officials, which will be released on Dec. 14 along with the Fed’s monetary policy decisions, to assess whether peak hawkishness has actually been reached yet.
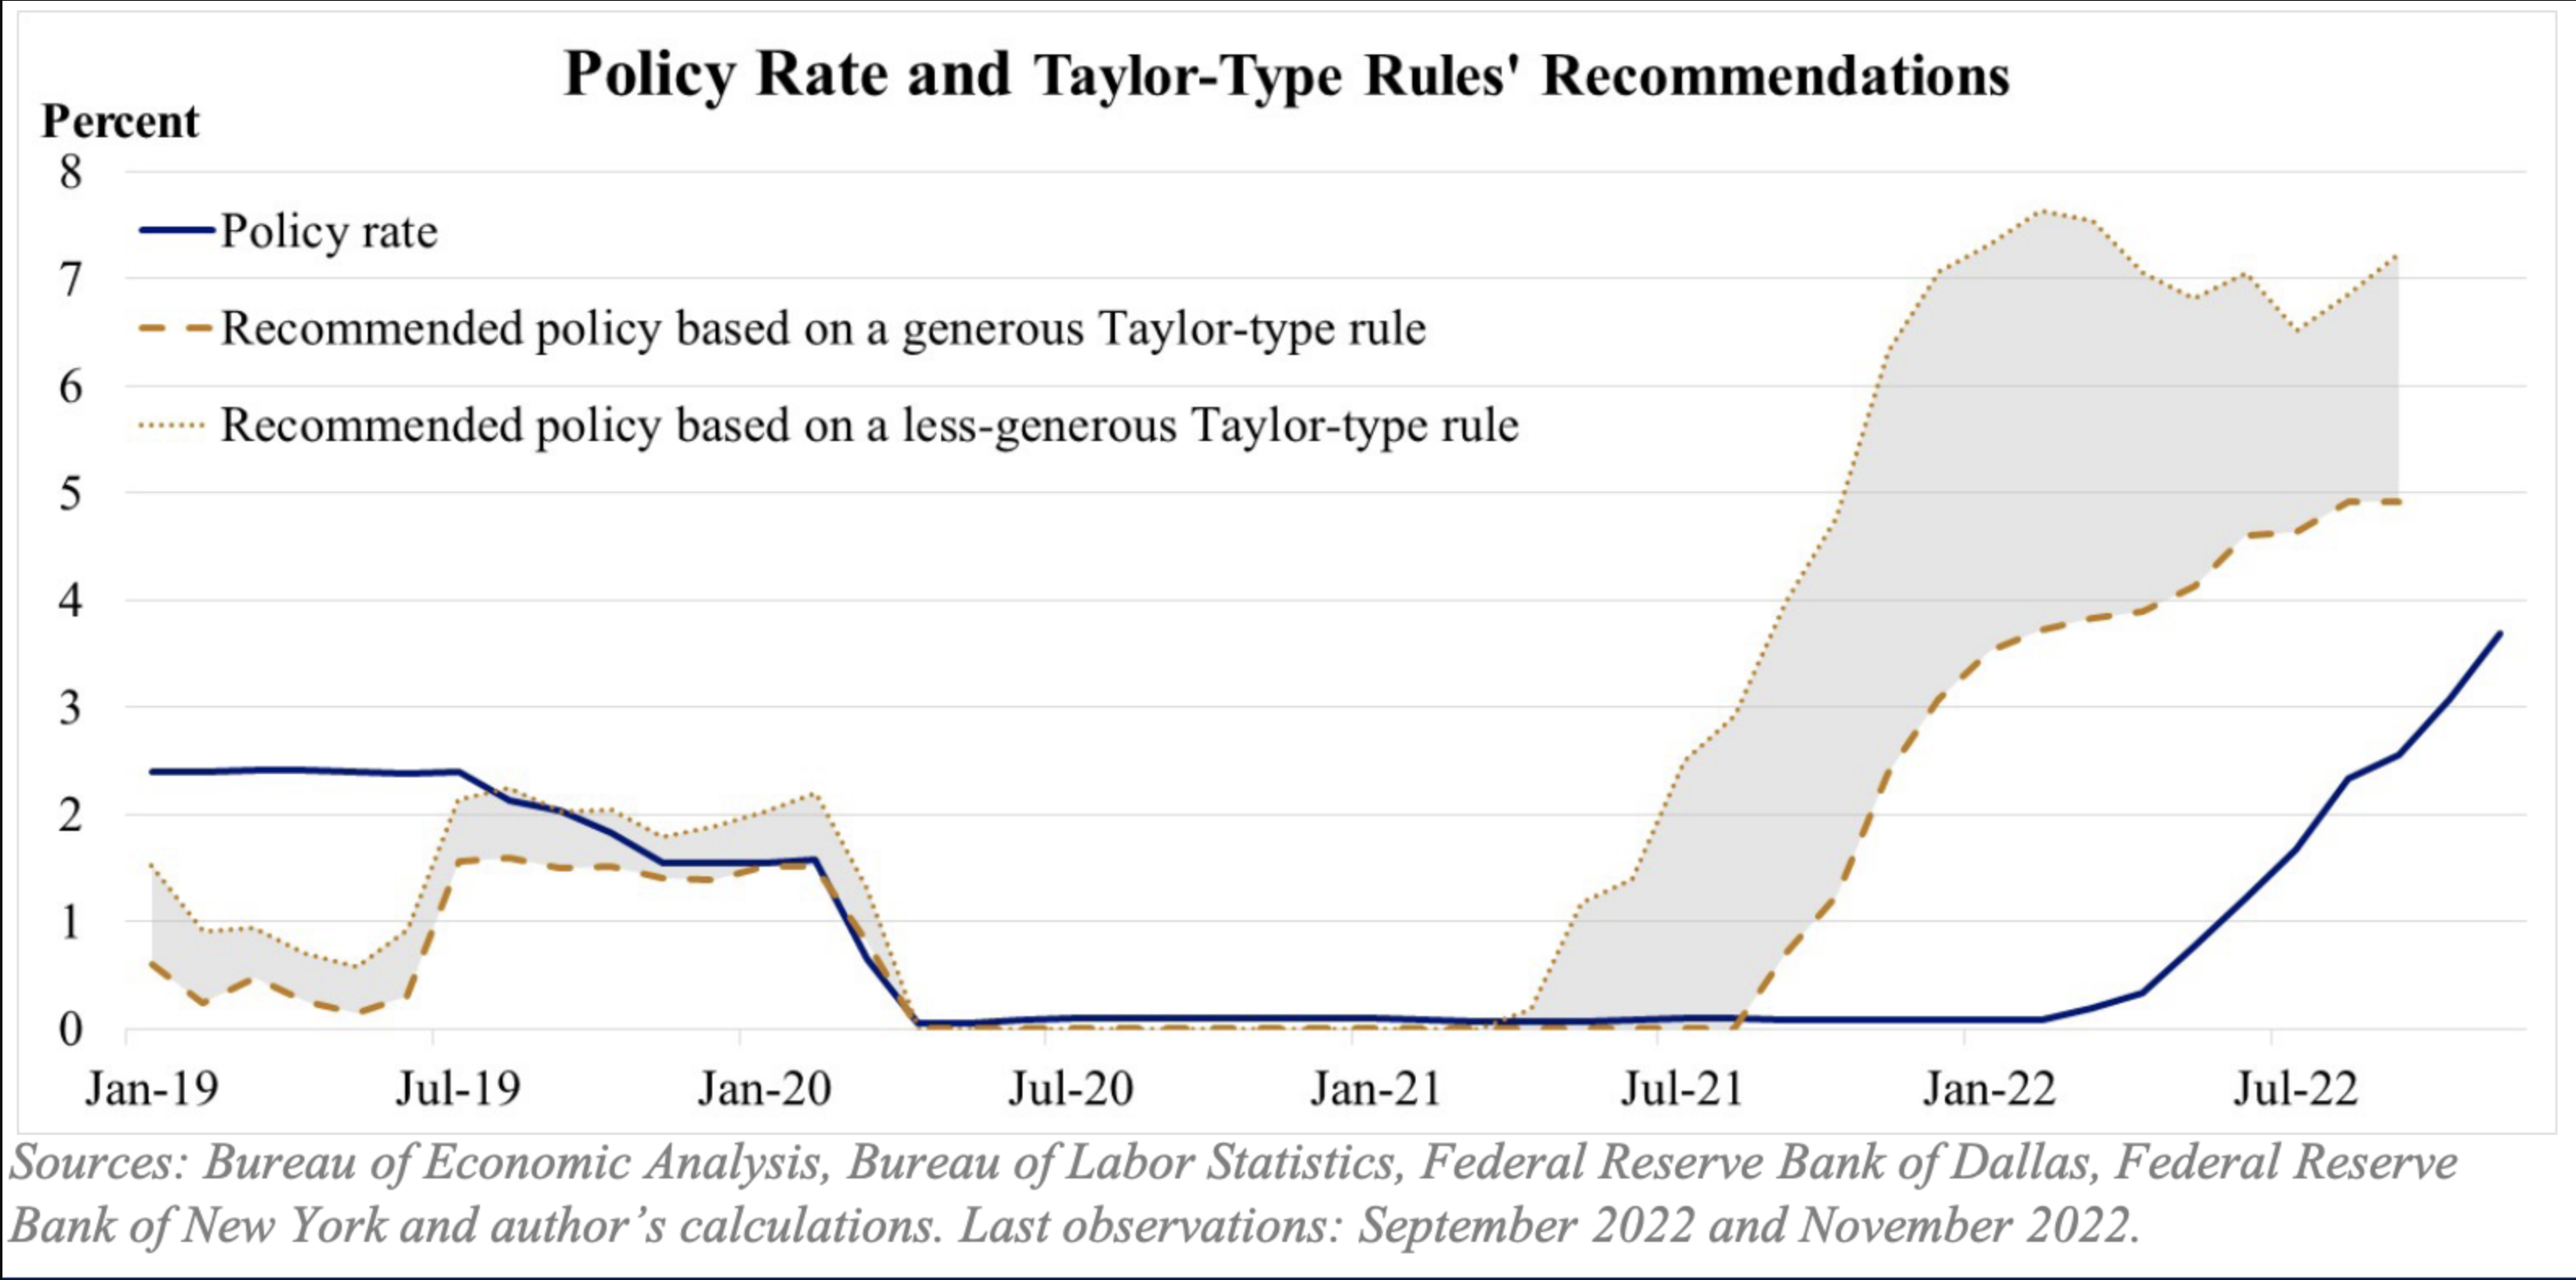
, head of the St. Louis Fed, most recently opined that the Fed’s monetary policy is not yet restrictive enough to counteract record inflation in the U.S., and said the 5% policy rate is the lower bound for the required policy rate, while the upper bound could be closer to 7%.
What matters most in the next phase for the stock market is the depth of the coming recession. While the in the USA has recently fallen into contraction territory as measured by the ISM, the is still going strong. Pantheon Macro attributes the outperformance of service providers primarily to a shift in consumer spending away from goods and toward services. However, with a cooling labor market next year, Pantheon Macro also expects a significant slowdown in the services sector as consumer savings deposits decline.
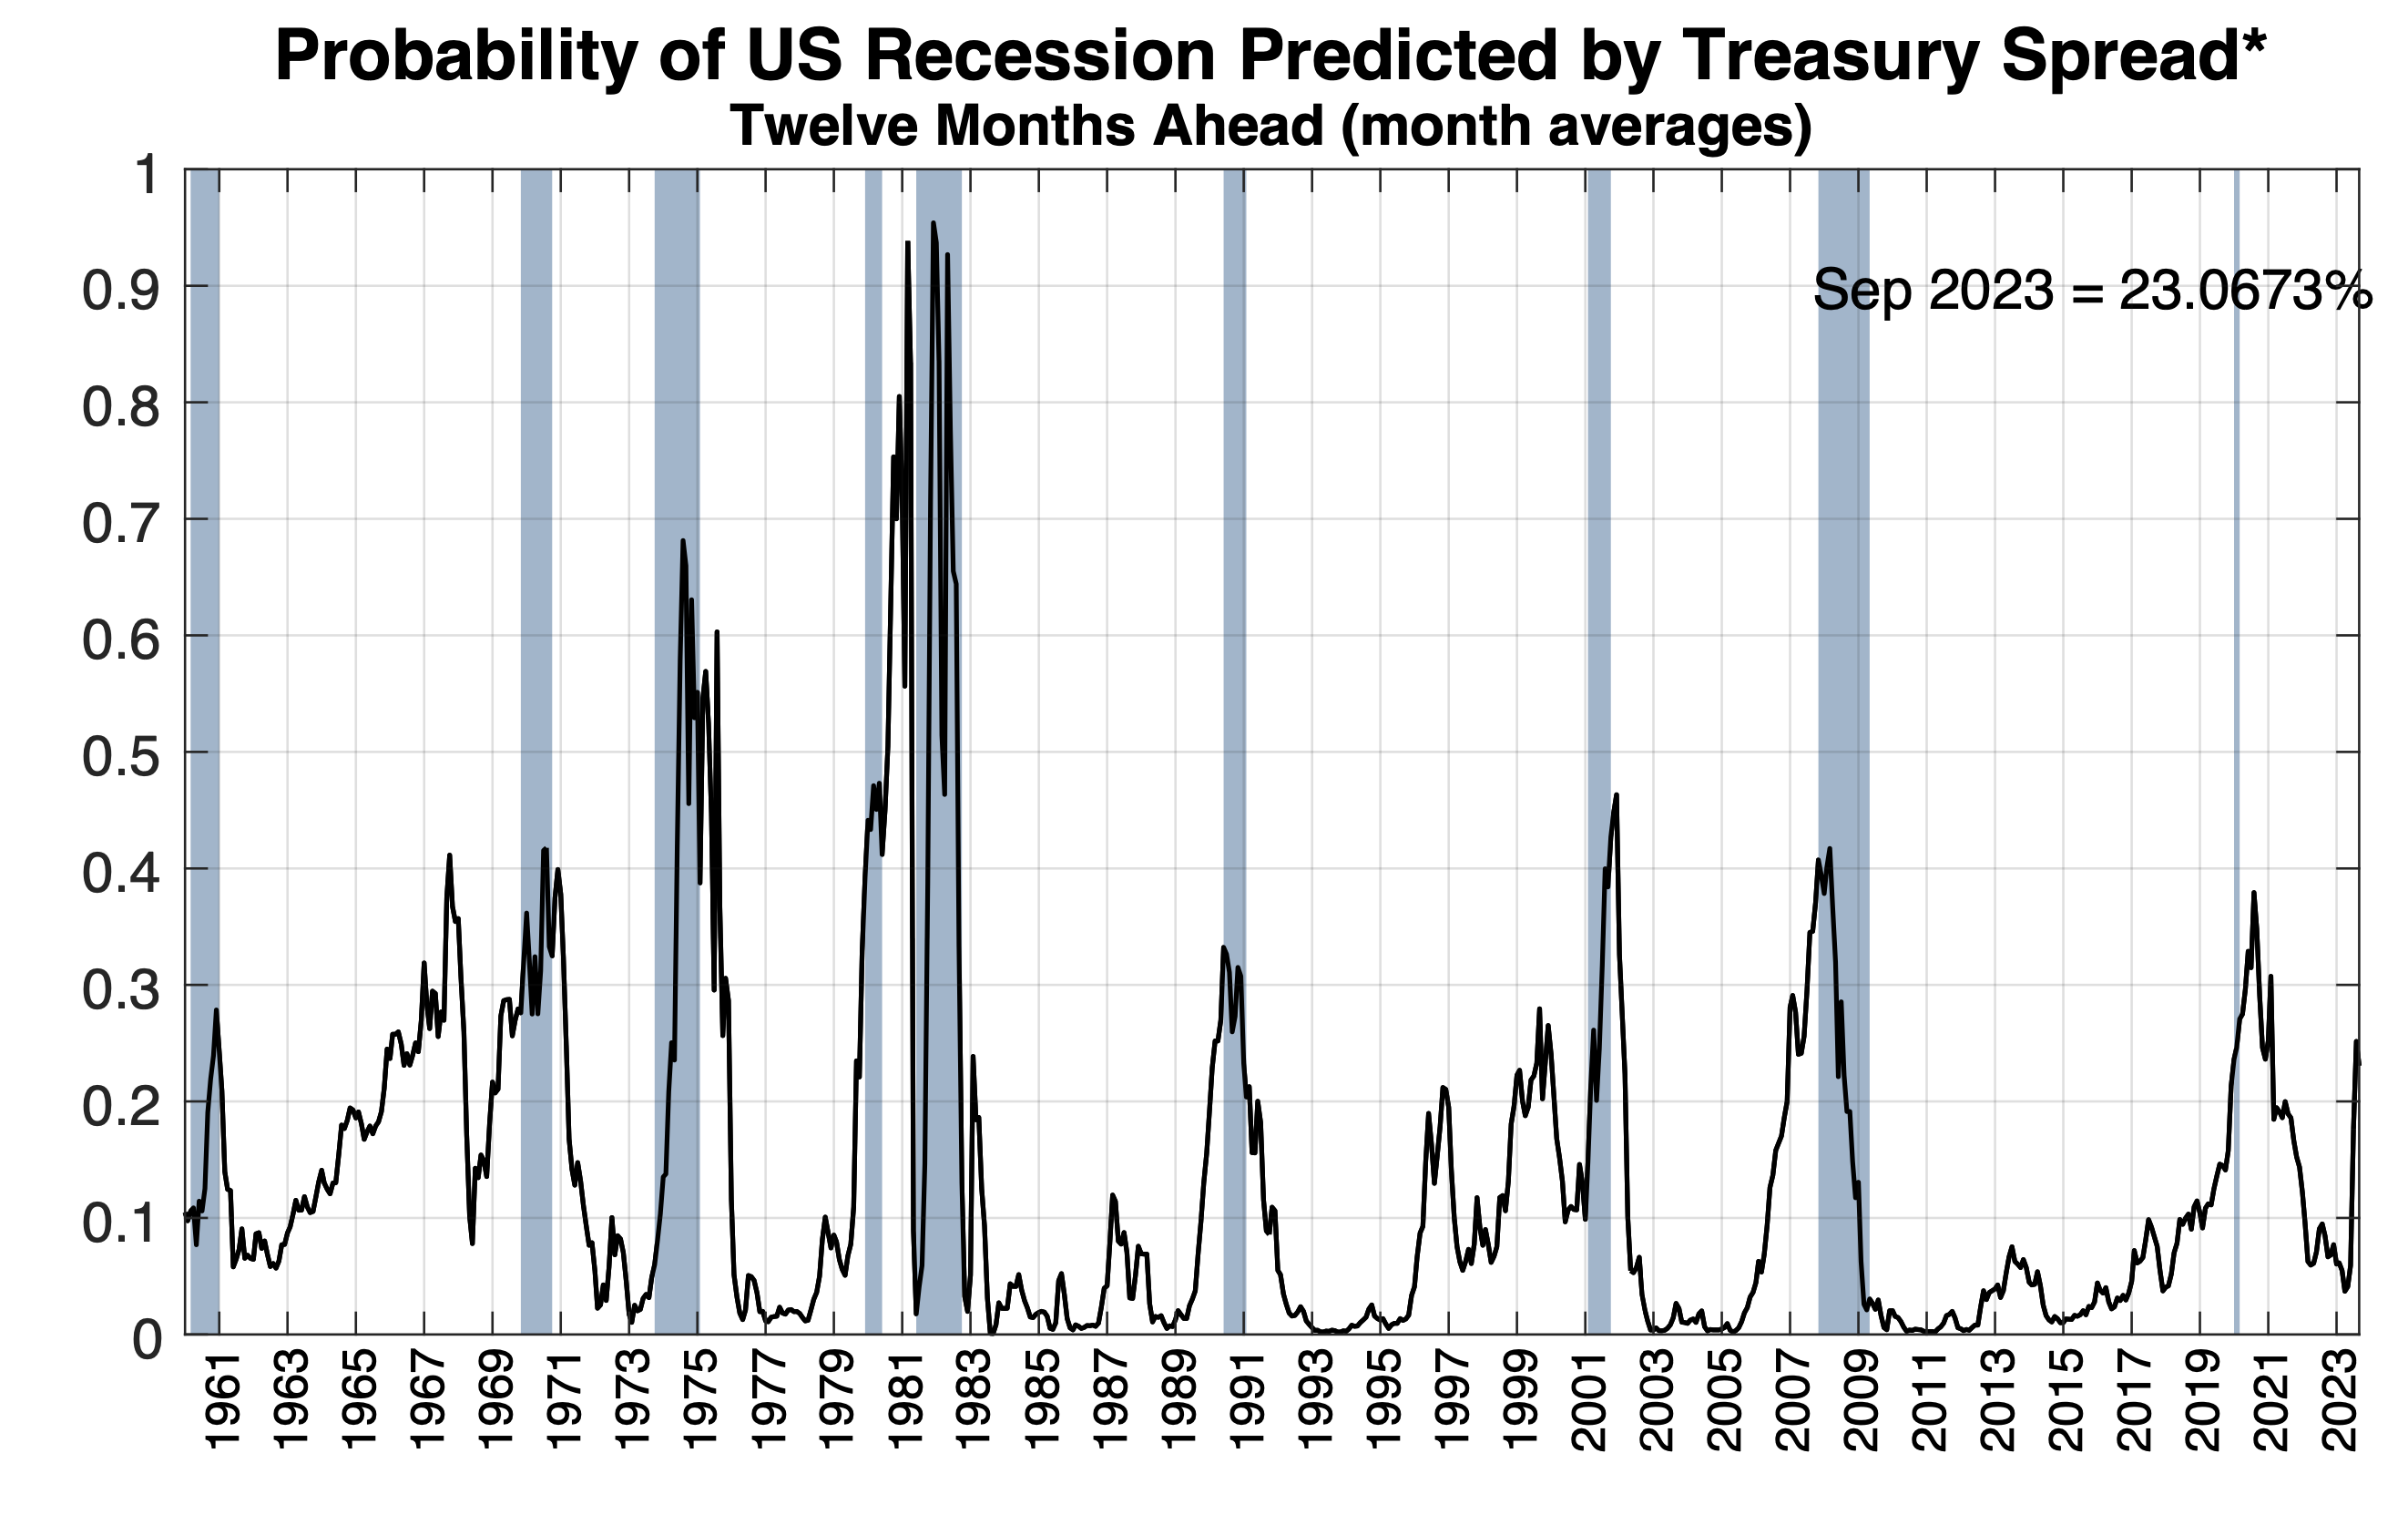
It’s pretty much a given that the US will slide into a recession, the only question is how severe it will be. The recession indicator calculated by the New York Fed puts the probability that the U.S. economy will be in recession in September 2023 at around 23%. As a rule, if this indicator is above the 30% mark, a recession has followed every time since 1960.
Source: New York Fed
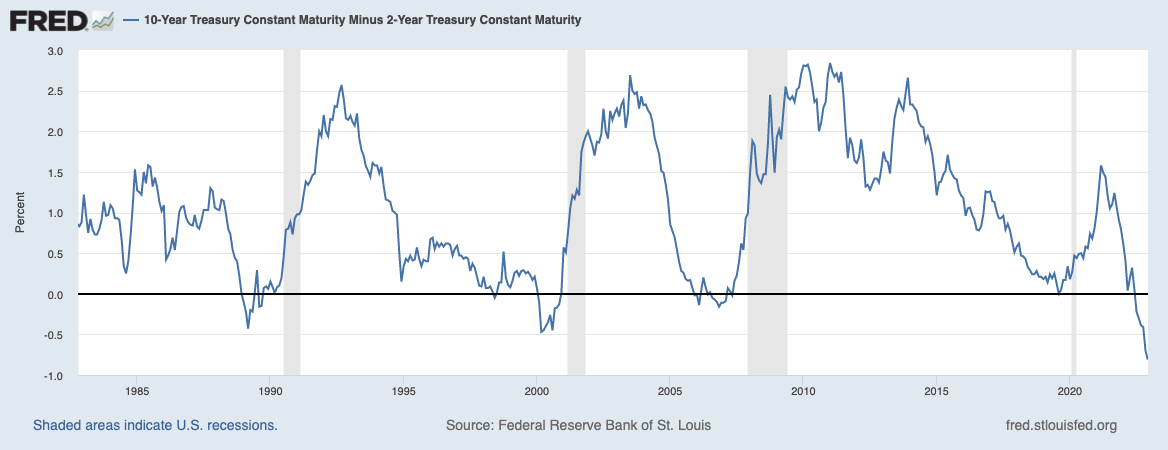
It is true that the stock market usually recovers before the end of a recession. But we are not yet in the recession stage. That is readily apparent from the , which is still massively inverted at 81 basis points and shows no signs of steepening yet, as has been the case in every other recession since 1990.
Source: St. Louis Fed
On average, excluding the Great Financial Crisis, the S&P 500 has lost about 24% of its value in every recession since the end of World War II. Currently, the drop from the peak to the current level is about 17%. So, there would still be plenty of room to the downside, especially given that the U.S. economy is heading for a recession, which will of course have a negative impact on corporate profits and consumer spending.
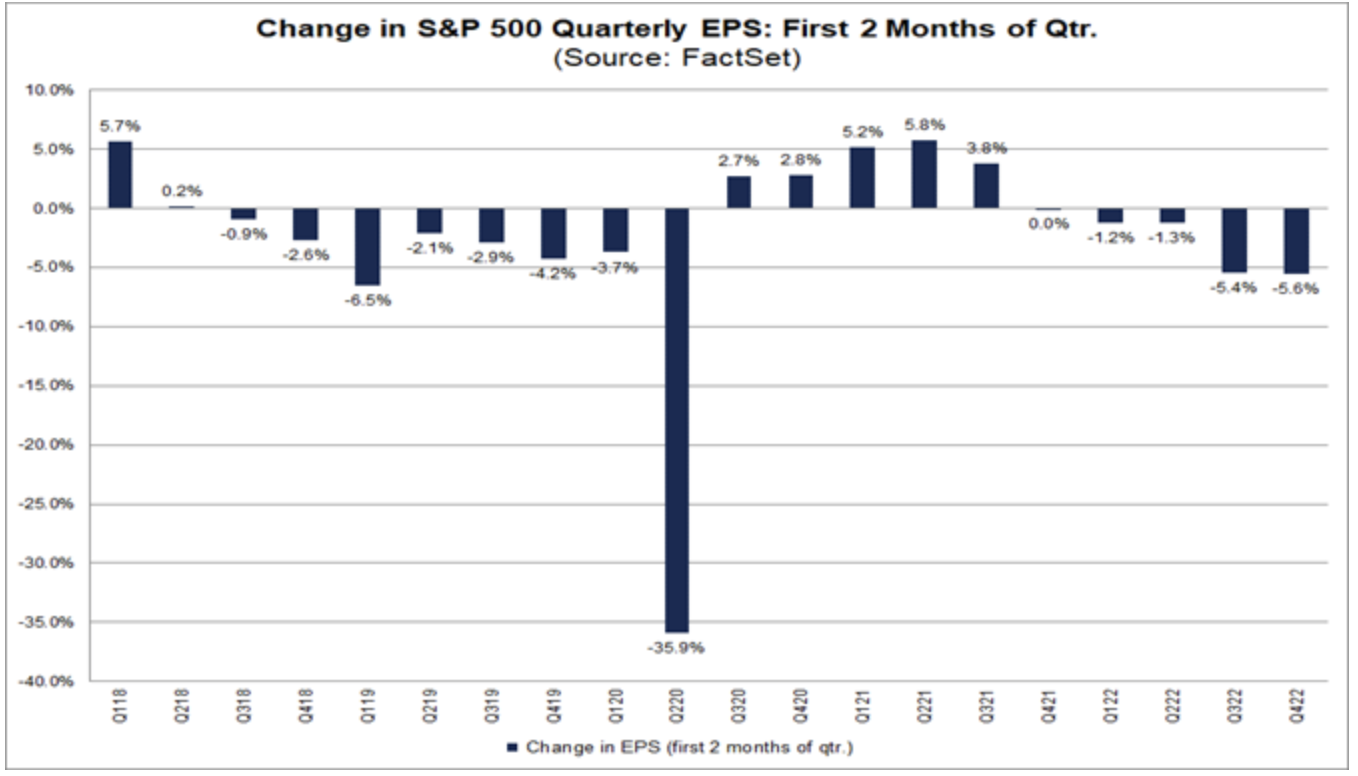
At -5.6%, analysts have slashed their earnings expectations in October and November, according to a recent FactSet report. That’s significantly worse than the last 20 quarters (-2.1%) and 40 quarters (-2.7%). Not only that, but 2023 earnings expectations are also plummeting, with 2023 EPS expectations falling 3.6% to $232.52 over the past two months, while at the same time the S&P 500’s expected P/E ratio has risen from 15.2 to 17.6 over the same period.
Source: FactSet
The average S&P 500 multiple during recessions is 14.5. Based on the current SPX level, this would result in a further discount potential of around 17.6%, provided the market prices recession and earnings risks accordingly.
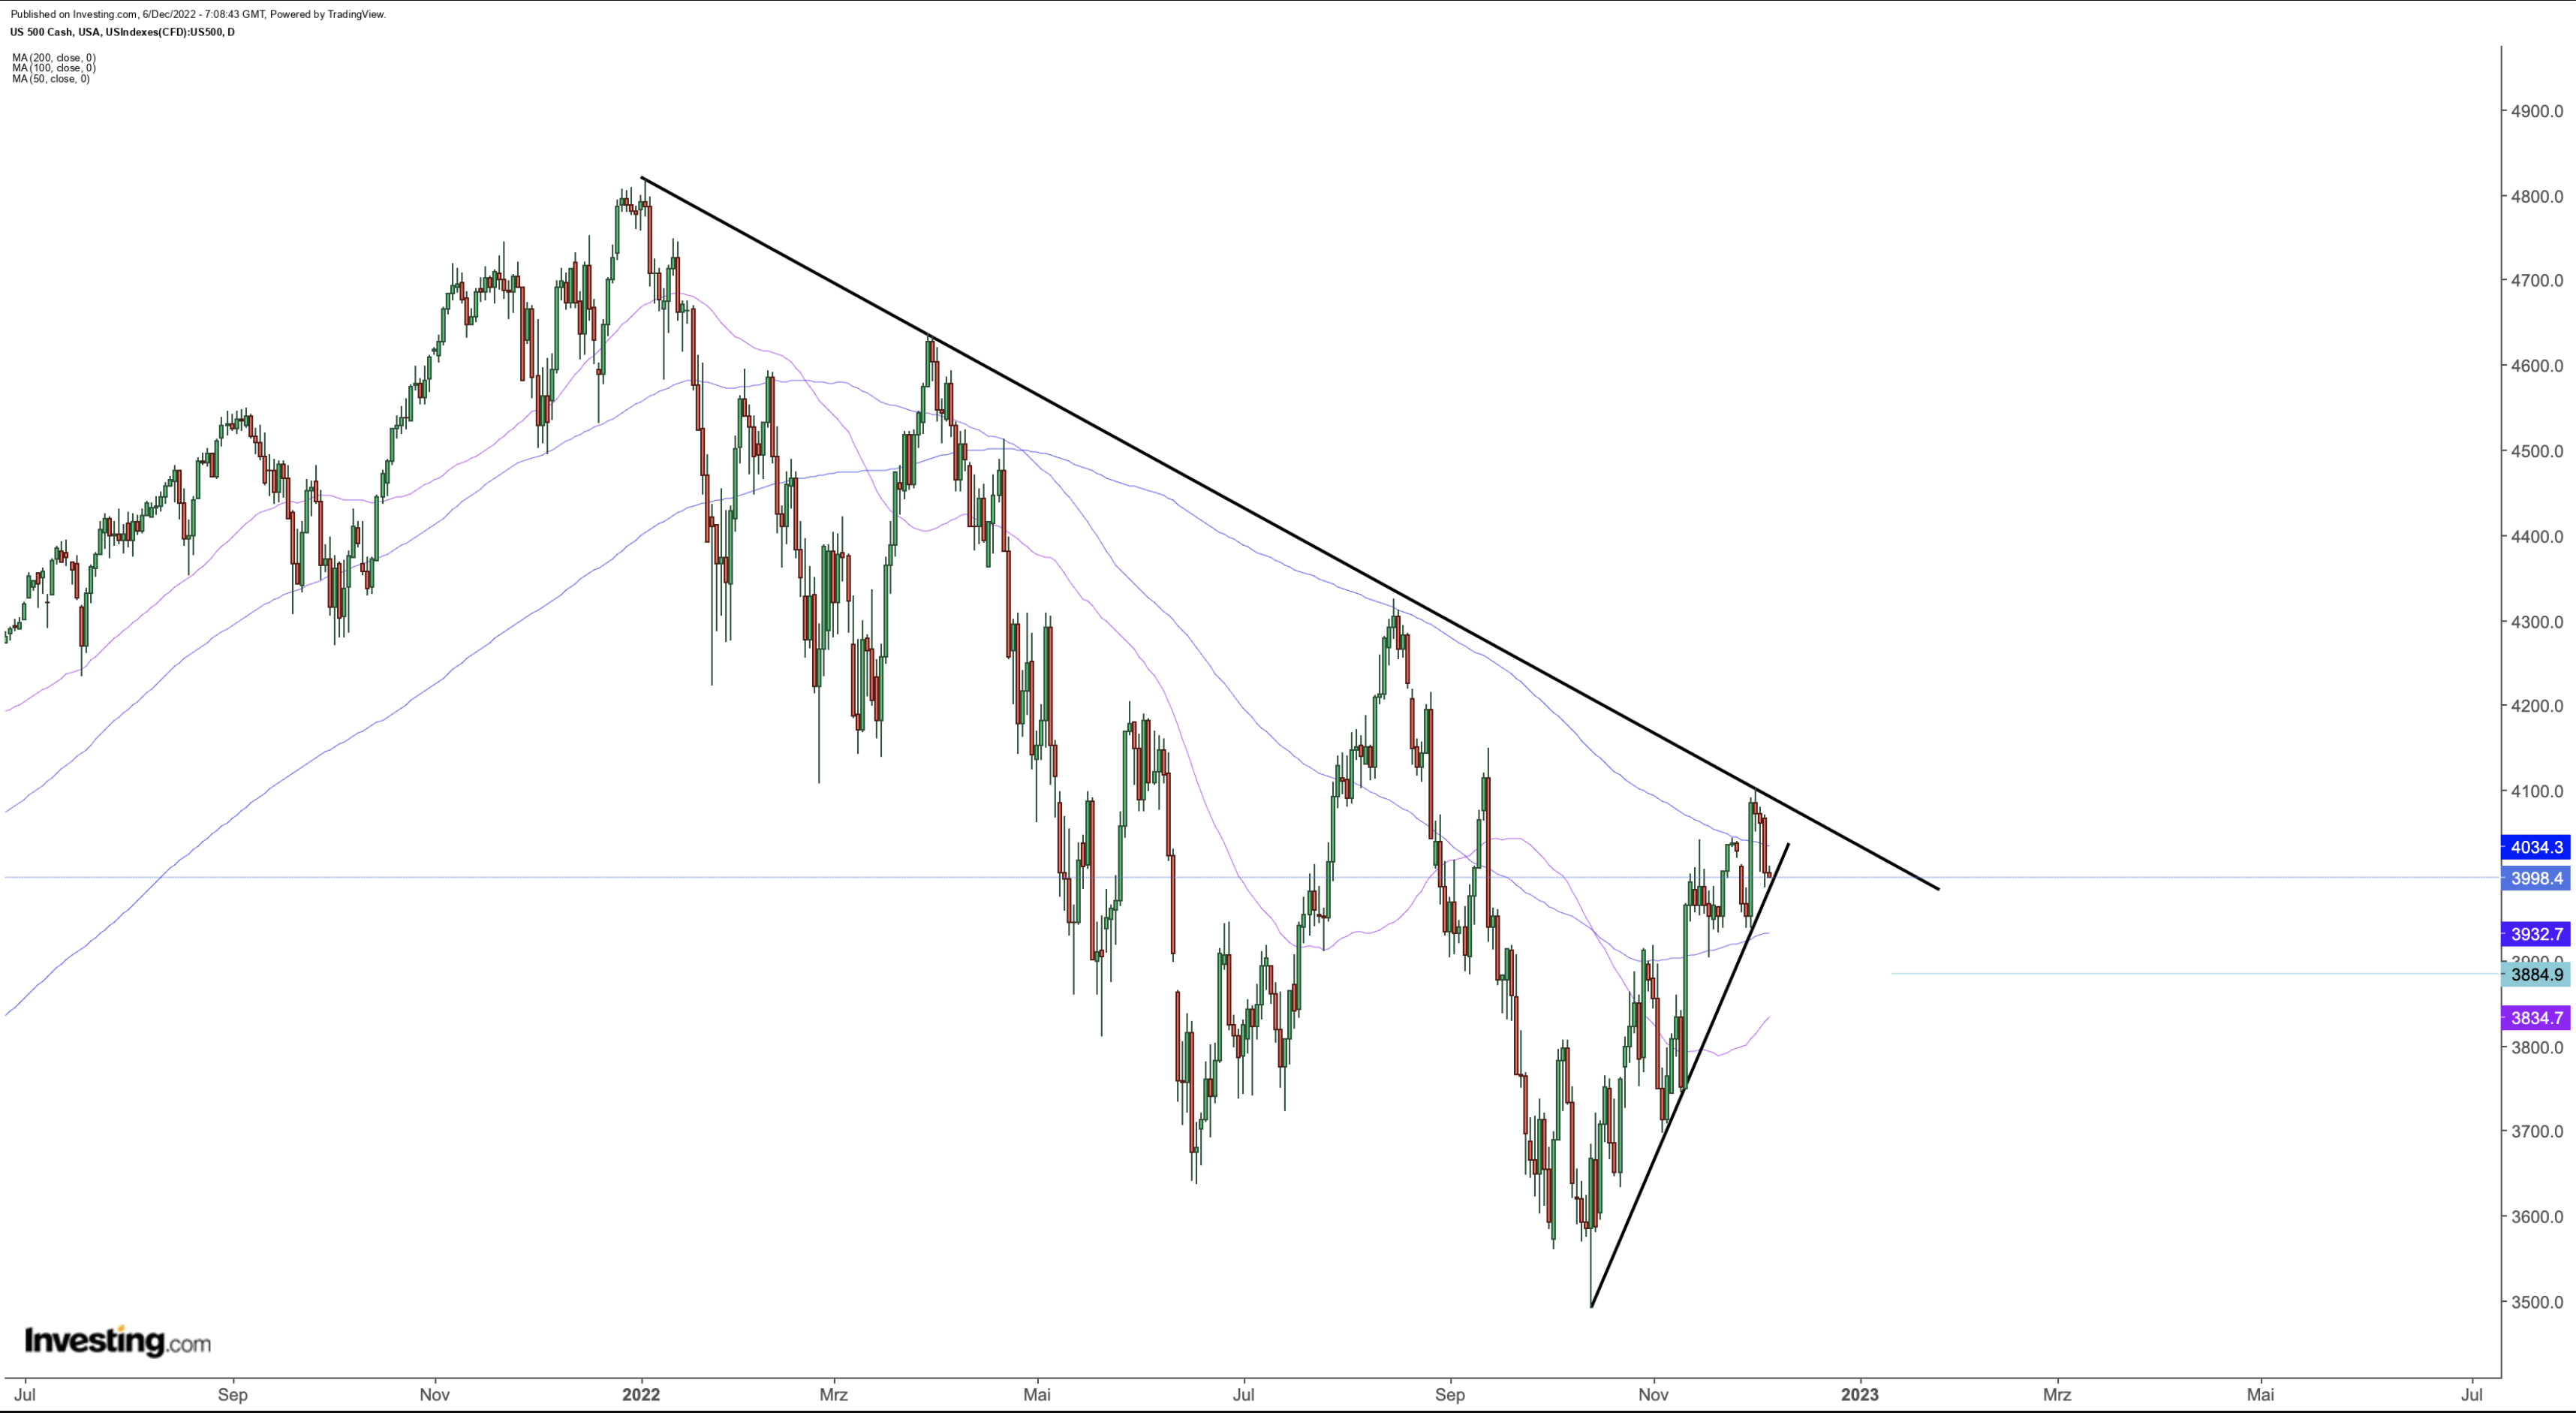
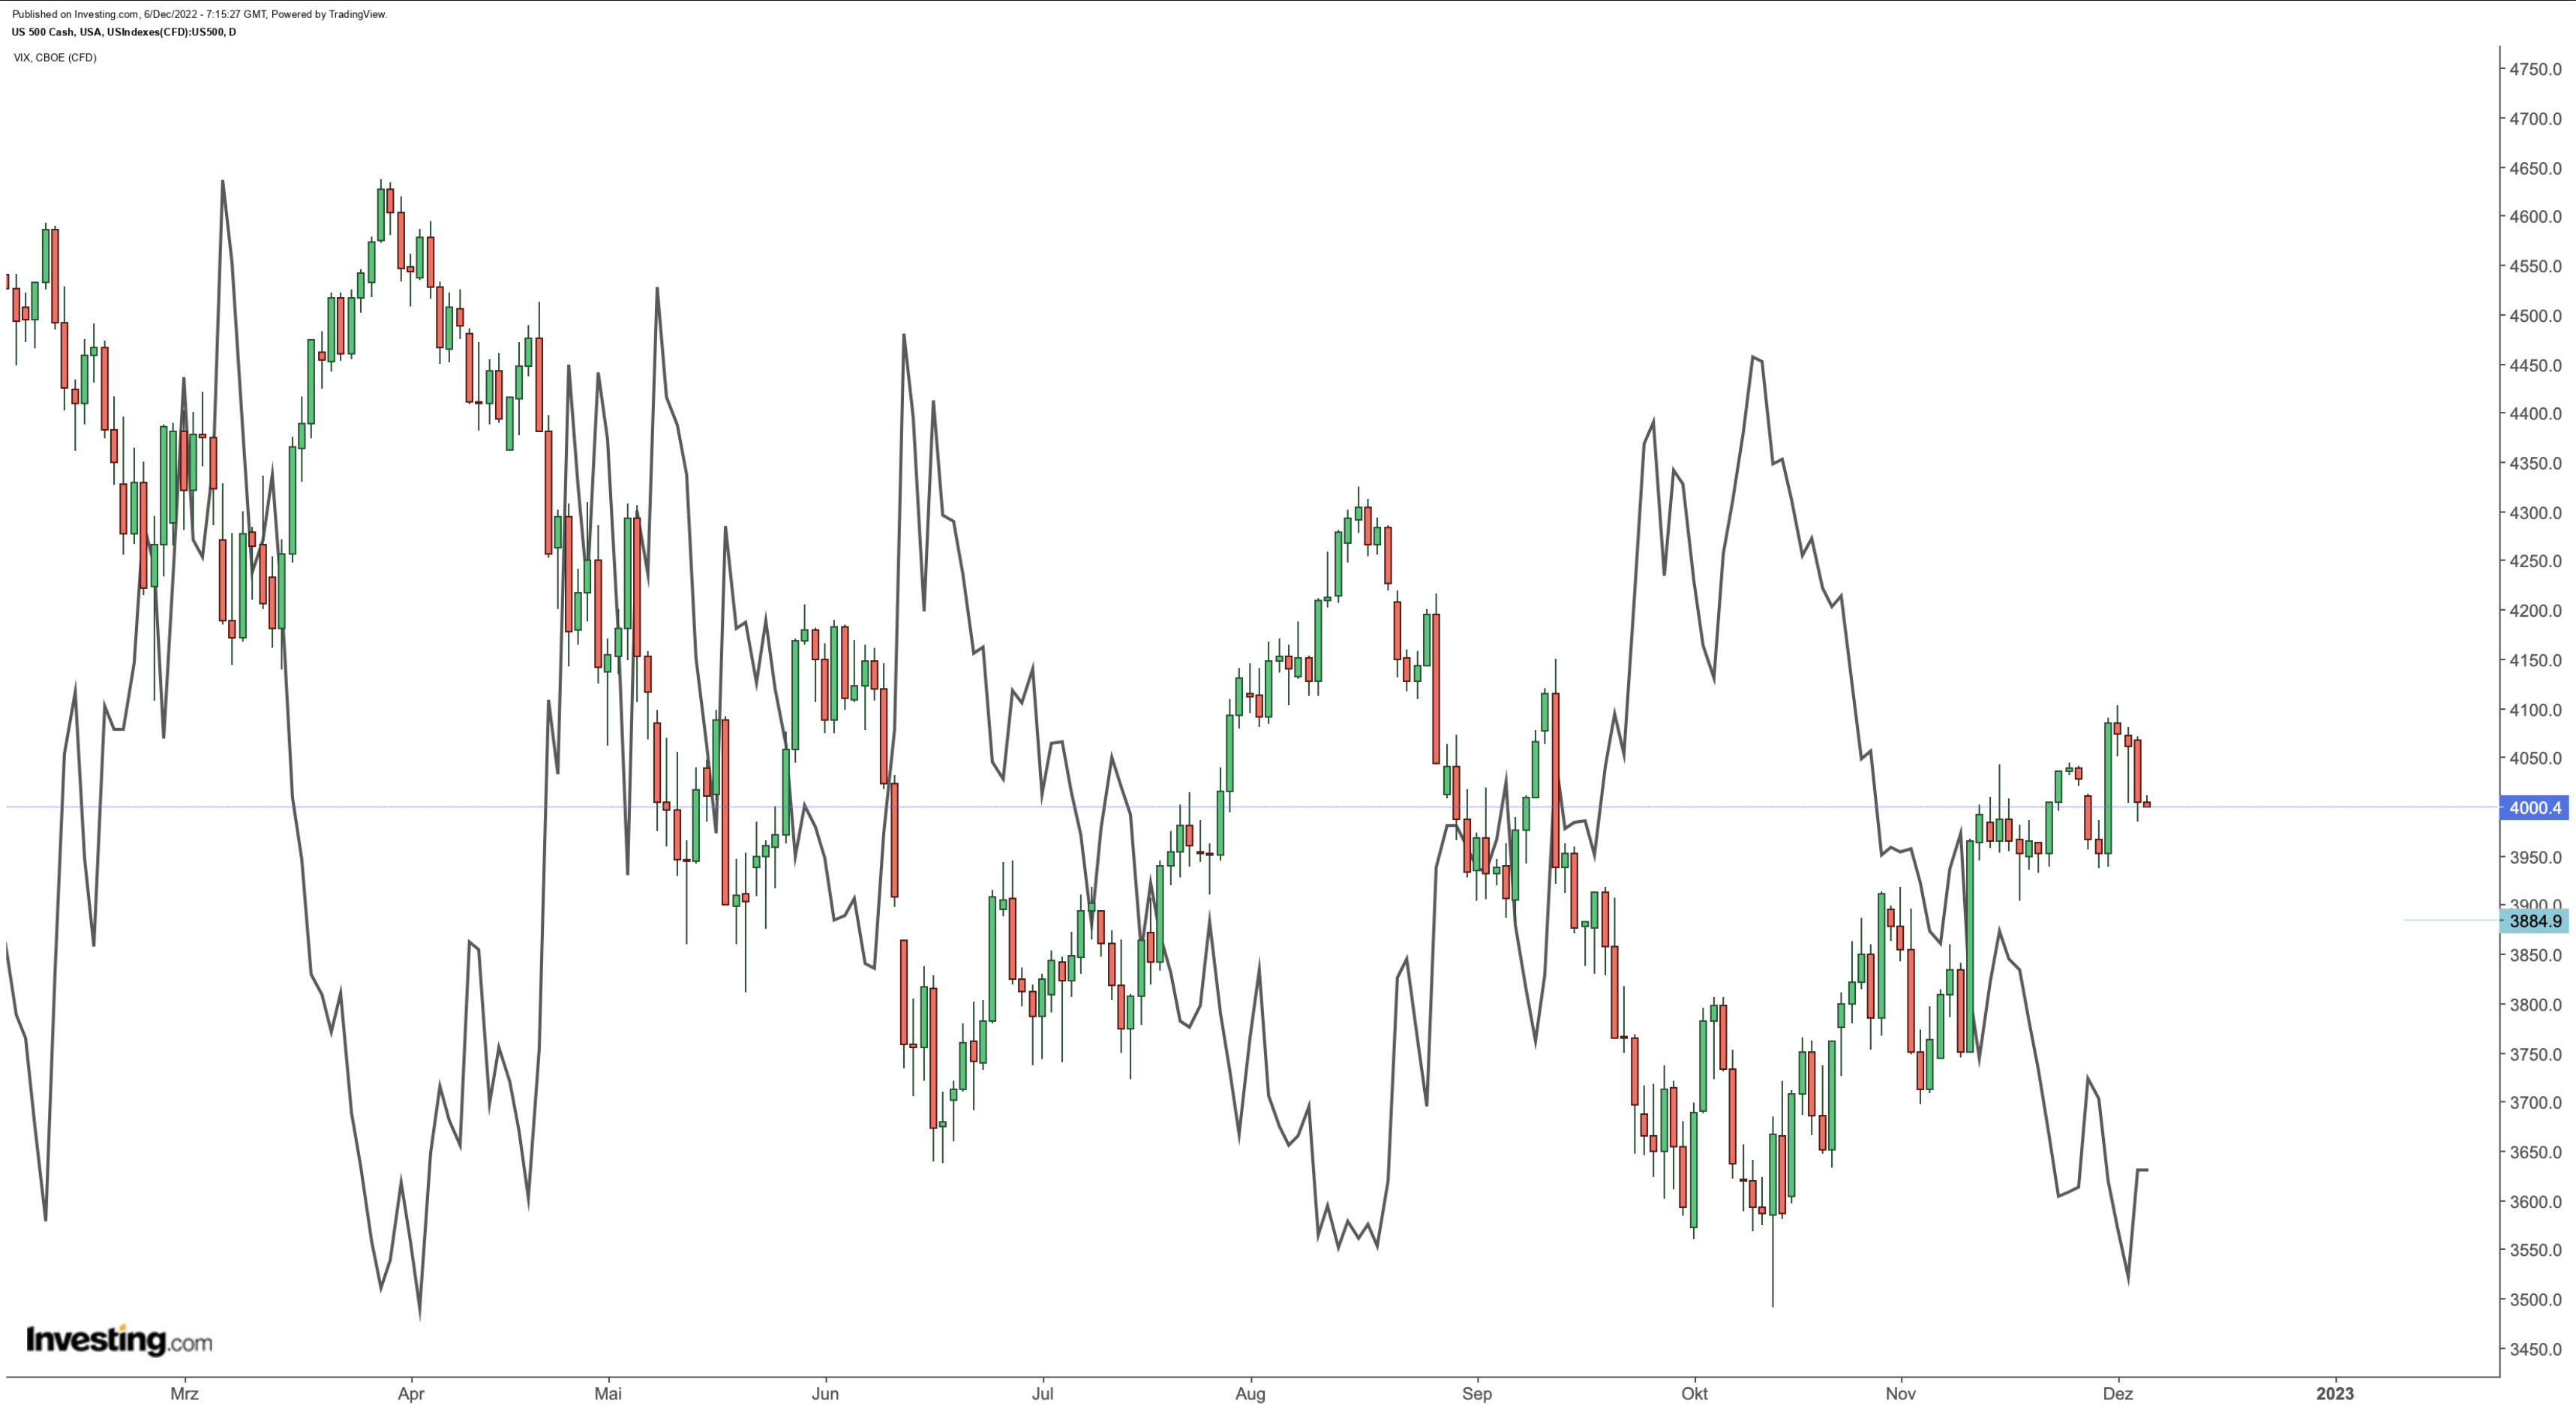
The chart of the S&P 500 is also in line with this, with the U.S. stock index reaching its low point only last week. As a result, there was a price correction, which even brought the S&P 500 back below its smoothing of the last 200 days. In the U.S., the average line is considered a particularly valid instrument for determining medium- to long-term price trends. Thus, the next few days will be of particular importance, because the next important mark that the S&P 500 must defend is already at 3,996 points. If this does not succeed, a relapse to the smoothings of the last 100 and 50 days at 3,932 and 3,834 points threatens.
Caution is also warranted at , which recently fell to 18.95 points, its lowest level since April 2022, sending a clear warning signal; after all, the S&P 500 has always turned downward this year when the VIX was close to below 20 points, or upward when the volatility barometer was above 35 points (+-2).
Also not fitting into the picture is the sector performance of the S&P 500 over the past month, where communications services (NYSE:) and technology (NYSE:) have been the best performers. It is true that both sectors usually outperform at the beginning of a new business cycle. However, we are very likely still in the final stages of the last business cycle and not at the beginning of a new one.

Taken together, the current rally is nothing more than a classic bear market rally, unless the Fed massively slams on the brakes in the next few months, lowers interest rates, and starts QE again, which seems unlikely at this point given its priority to cool the economy.
Disclaimer: The content does not constitute a trading recommendation to buy or sell any type of security or derivative.
[ad_2]


