Apple: Break Above $233 May Clear Path for Shot at ATH Ahead of iPhone 16 Launch
2024.08.28 09:19
Apple (NASDAQ:) is gearing up to lead the tech industry once more with the release of its AI-powered iPhones this fall. Investor enthusiasm remains strong, with revenue projections indicating significant gains in the upcoming quarters.
The new iPhone 16 and Apple’s “Apple Intelligence” initiative are expected to drive future growth, making the consumer products giant’s stock even more appealing to investors.
Since Apple introduced its AI strategy in June, the stock has risen 10%+. It now seems to be heading toward all-time high levels and may do so before the official launch of the iPhone 16.
Big Expectations From iPhone 16 Sales
Apple is set to launch the iPhone 16 on September 9, and the anticipation surrounding this is palpable.
Wedbush analysts predict that the upcoming AI-powered iPhone launch will usher in a period of unprecedented growth for Apple.
Recent market research indicates that this upgrade cycle could revitalize Apple’s growth over the next year.
Wedbush expects iPhone 16 shipments to surpass 90 million units. This represents a double-digit increase compared to the previous year.
With an estimated 300 million iPhones worldwide remaining unupgraded for over four years, there is significant potential for a surge in demand.
Longtime CFO Departs
Following the market close on Monday, Apple announced that its longtime CFO Luca Maestri will step down from his role on January 1 after over a decade in the position.
Maestri will continue overseeing Corporate Services. Kevan Parekh, an 11-year Apple finance veteran, will succeed him as head of finance.
The stock ended lower on Monday following this news.
Technical View: Is Apple Poised to Reach All-Time Highs?
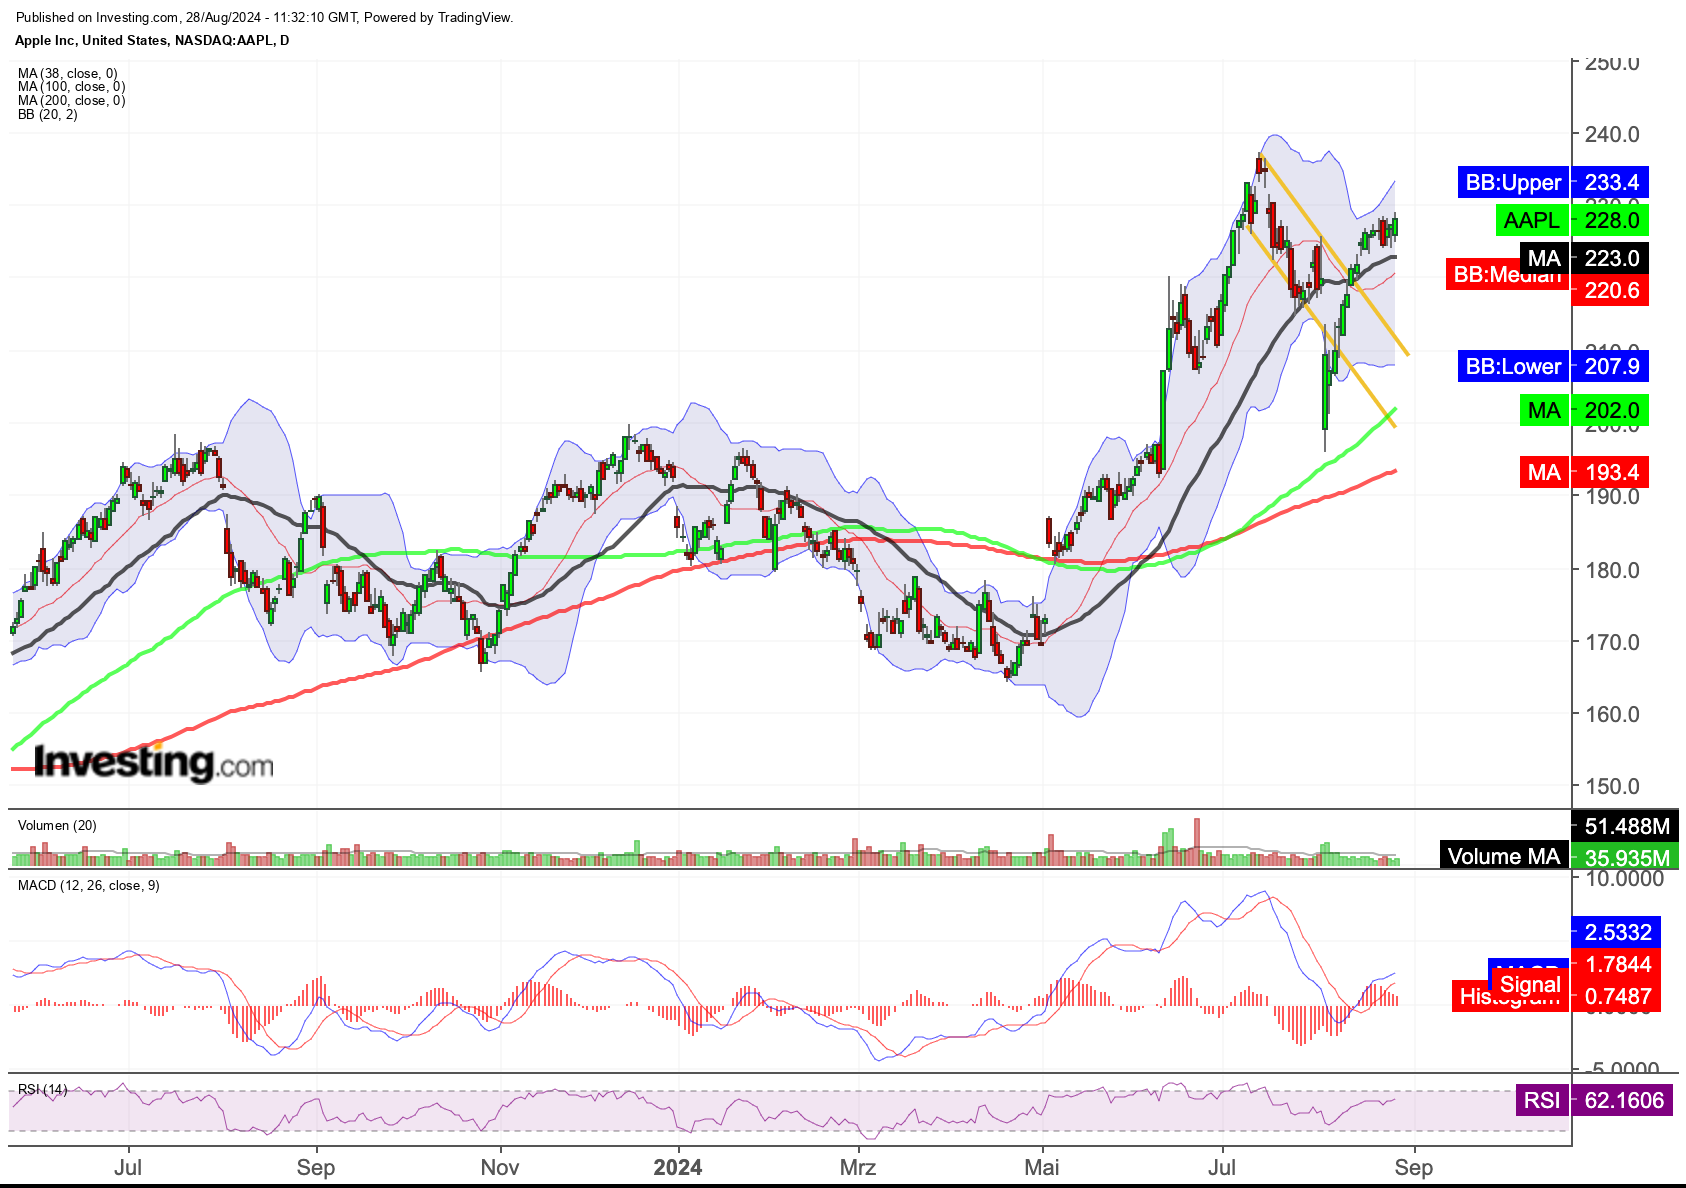
Apple shares have recently seen a dynamic recovery, with the price now at $228, above key moving averages. The stock is trading comfortably above the 38-day moving average, currently at $223, signaling solid short-term support.
The 100-day line at $202 and the 200-day line at $193.4 also provide reliable support levels.
The current chart suggests that Apple shares could continue their upward trend after a brief pause. The key level for bulls to watch is the upper Bollinger Band, currently trending upwards at $233.4.
As long as the upper Bollinger Band maintains its upward trajectory, the stock is likely to move toward its all-time highs. A breakthrough above this resistance level could signal a continuation of the rally, potentially pushing the stock toward the $240 mark.

Moreover, the MACD indicator remains positive, giving the bulls additional momentum. Closing the recent price gap at $233 would further strengthen the technical outlook, paving the way for higher prices.
However, caution is advised if the price dips below $223. Falling below this level could trigger a short-term weakness, possibly pushing the share price toward the $215 support level. A breach of this level would significantly weaken the technical picture.
Overall, the chart remains positive for Apple as long as the price stays above $215 and the upper Bollinger Band continues to point upwards. A breakout above $233.4 would position the bulls well for a test of the all-time highs and beyond.
***
Disclaimer: This article is written for informational purposes only. It is not intended to encourage the purchase of assets in any way, nor does it constitute a solicitation, offer, recommendation or suggestion to invest. I would like to remind you that all assets are evaluated from multiple perspectives and are highly risky, so any investment decision and the associated risk is at the investor’s own risk. We also do not provide any investment advisory services. We will never contact you to offer investment or advisory services.


