Analysis-Oil inventory drops set stage for higher prices
2023.07.31 00:48

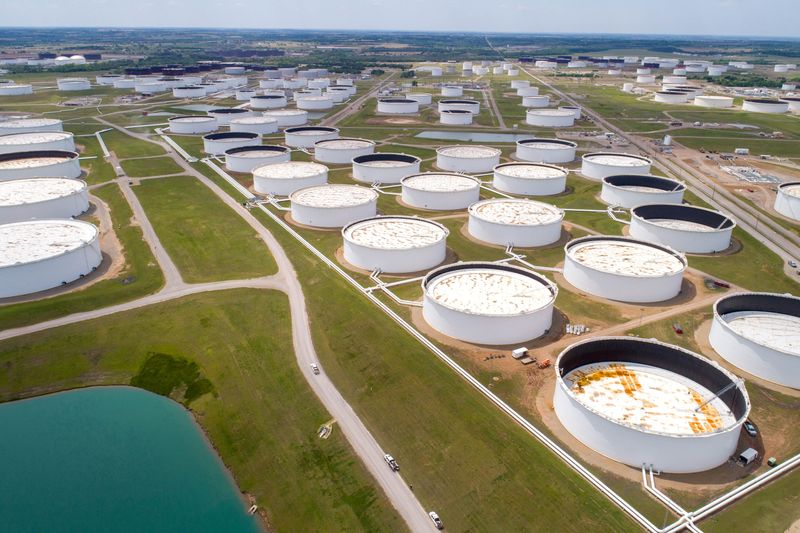
© Reuters. FILE PHOTO: Crude oil storage tanks are seen in an aerial photograph at the Cushing oil hub in Cushing, Oklahoma, U.S. April 21, 2020. REUTERS/Drone Base/File Photo/
By Ahmad Ghaddar, Arathy Somasekhar and Trixie Yap
LONDON/HOUSTON/SINGAPORE (Reuters) – Oil inventories are beginning to fall in some regions as demand outpaces supply constrained by deep production cuts from OPEC leader Saudi Arabia, providing support for prices which are expected to rise in coming months.
JP Morgan analysts said this month that oil inventories – which include crude and fuel products – now play a bigger role in determining oil prices than the U.S. dollar because Western sanctions on Russia have accelerated oil trading in other currencies.
“We expect stocks to draw relatively aggressively in July, and by the end of August, we should be through the stock builds that we saw in the first half of the year,” said Christopher Haines, an analyst at Energy Aspects.
“We are on the cusp of supply tightness. Saudi cuts are essentially accelerating the timeline.”
Both the International Energy Agency (IEA) and the Organization of the Petroleum Exporting Countries (OPEC) expect oil demand to outpace supply this year, leading to overall inventory draws to the tune of 400,000 to 500,000 barrels per day (bpd), mostly accounted for by the second half of the year.
Although global oil inventories increased in May to their highest since September 2021, according to the IEA, driven by a substantial rise in non-OECD countries, analysts say signs of tightness are appearing, in the United States in particular.
Stock declines have been geographically uneven so far, with inventory falls in the United States and Europe offset by increases in China and Japan.
The declines have also been skewed more towards fuel than crude, although the supply of sour crude, typically priced lower than sweet crude, has tightened because of the cuts introduced by OPEC and its allies.
“It appears that the voluntary cuts announced by eight OPEC+ countries in April plus the additional 1 million bpd of unilateral Saudi cut that just started in July are having the desired effect, with sour barrels becoming more scarce,” the JP Morgan analysts said.
Refineries running harder to meet rising summer demand as people drive and fly more partly explains the fall in inventories, the bank said, along with a drop in Russian oil exports this month.
The bank expects benchmark prices, which traded around a three-month high of $84 a barrel this week, to rise to $86 a barrel by the end of the third quarter, before easing in the fourth quarter as inventories start to build again.
UBS said it expected a rise to $85-$90 a barrel over coming months.
Crude stocks at the Cushing storage hub in Oklahoma fell by 2.9 million barrels in the week to July 14, the steepest draw in more than a year and a half according to the U.S. Energy Information Administration (EIA), and shed a further 2.6 million barrels the following week, leaving them well below their five-year average.
For fuel, data from consultancy FGE Energy on key hubs in the United States, northern Europe, Japan, Singapore and Fujairah in the United Arab Emirates, shows that overall stocks have been drawing aggressively so far this month, both onshore and at sea.
Weekly stocks of diesel, jet fuel and fuel oil in the five regions are also currently below their five-year averages.
U.S. gasoline stocks of 217.6 million barrels are at their lowest level for the time of year since 2015, according to EIA data, and 5 million barrels, or 5%, lower than the prior 10-year seasonal average.
BIG CRUDE BUILDS IN ASIA
Big crude builds in China and Japan have so far offset a drop in the Mideast Gulf, meaning there is no sign yet of an overall global onshore crude inventory drawdown, according to satellite analytics firm Kayrros.
In fact, data from the firm shows that crude inventories in the week to July 20 reached a two-year high, with the world adding 200 million barrels into storage since Russia’s invasion of Ukraine in February 2022.
This amounts to roughly 400,000 bpd over that time period, the daily oil consumption of Portugal.
China accounts for the lion’s share of the gains, adding 700,000 bpd since mid-April, which Kayrros co-founder Antoine Halff noted was commercial rather than strategic.
He attributed the build to weak Chinese industrial activity and the import of discounted crude from Russia, Iran and Venezuela.
Crude inventories in Japan have added 25 million barrels, or 8%, since April to stand at their highest in nearly two years, according to Kayrros.
China’s diesel inventories also rose sharply over Nov. 2022-Feb. 2023 and have remained at elevated levels since.
MIDEAST GULF DRAWS
Crude stocks in the Mideast Gulf and North Africa region have declined by 5 million barrels overall so far this year, according to estimates by Macquarie, although OPEC members in the region have drawn 10 million barrels.
“I think Iranian barrels, both floating and onshore, had been making their way through different parts of Asia…and then ending up in China,” said Macquarie analyst Vikas Dwivedi about what could be driving the draw.
Like JP Morgan, Dwivedi believes inventories will fall in coming weeks before starting to build again in the fourth quarter as refineries slow throughput and higher oil prices drive some OPEC+ members to exceed their production quota to maximise revenue.
“We’re bullish right now. This is the first time we’ve been bullish for a long, long time. Over about 18 months we’ve been bearish,” he said.


