Analysis-Global metals volumes slide on recession fears, volatile markets
2022.10.03 21:30
[ad_1]
2/2

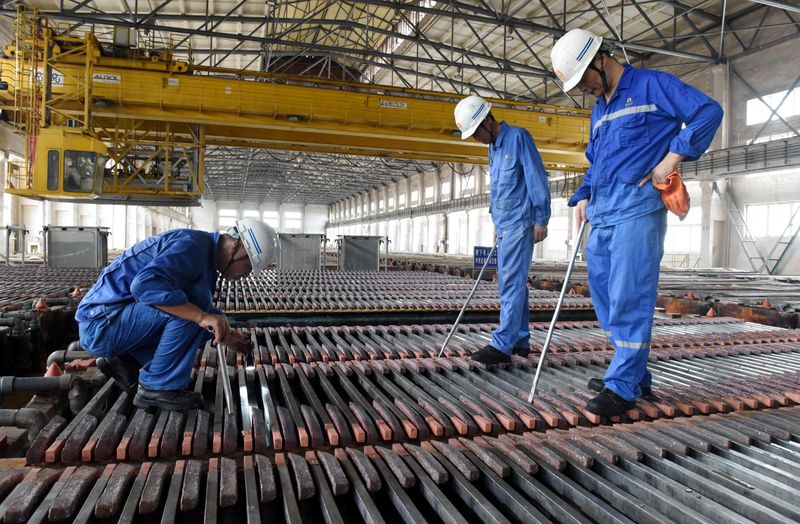
© Reuters. FILE PHOTO: Workers inspect the production of copper cathodes at a Jinlong Copper plant in Tongling, Anhui province, China August 16, 2018. REUTERS/Stringer
2/2
By Eric Onstad and Mai Nguyen
LONDON/HANOI (Reuters) – Industrial metal trading volumes have fallen across the world and may slide further as economic threats from higher interest rates to the war in Ukraine send buyers, especially in leading consumer China, to the sidelines.
Aggressive interest rate hikes have fuelled real concern about impending recession, while confidence is also still reeling after wild price swings during the first quarter following Russia’s invasion of Ukraine.
Trading volumes of have tumbled by up to a third on global commodity exchanges so far this year, and those in most other industrial metals also slumped, with nickel hardest hit.
Weakening appetite for industrial metals is an ominous sign for the global economy, for which “Doctor Copper” – nicknamed for its widespread use in industrial processes from construction to power and manufacturing – is seen as a key indicator.
While the relationship is complicated by other factors such as exchange fees and margins, a comparison of copper volumes with both global growth and manufacturing show correlations which analysts estimated at 60%-80%.
“Clearly the threat of recession may well be playing a part in participants looking to reduce their exposure to metals,” said independent consultant Robin Bhar.
Graphic: Global GDP and Dr. Copper –
Graphic: Global Manufacturing PMI and Dr. Copper –
CHINA HIT HARDEST
Exchanges in China, the world’s biggest producer and consumer of commodities, have seen some of biggest erosion in activity, with copper volumes on the Shanghai Futures Exchange (ShFE) down 33% so far this year through August.
In addition to an economic slump and a property crisis, China’s government has taken a tough line on COVID-19 infections, imposing severe lockdowns in the country’s commercial hub of Shanghai.
People were reluctant to take big trading decisions during lockdowns, said Tiger Shi, managing director of BANDS Financial in Hong Kong. “The lack of face-to-face interaction hindered company employees making trading strategies,” he added.
“Another (factor) is the slowdown of the economy. Everyone is taking a more conservative approach.”
Some copper trading in China has shifted to a new international copper contract on Shanghai’s International Energy Exchange (INE), but that only accounts for a small portion of the decline on ShFE, traders said.
INE volumes gained by 819,288 tonnes so far this year, but ShFE activity slid by 74.4 million tonnes.
Graphic: Copper Volumes Weaken on Global Exchanges –
FUNDS STAY ON SIDELINES
The U.S. Comex market is favoured by funds and speculators, but their wariness saw average daily volumes of copper skid 21% in the first eight months of the year.
“The macro is signalling you to sell or go short, but you’d be very cautious because of the ability of a short market to bite back,” said Bhar. “You may lose your shirt.”
Many investors are bullish about copper in the long term due to expected growing demand in electric vehicles and renewable energy, but are holding back in the short term, said Tom Nelson, a portfolio manager at investment manager Ninety One.
“Copper in the very near term is very well supplied, so you can be very bullish copper for the energy transition, but hold back for a year or two because of near-term supply trends.”
PHYSICAL BUSINESS BOLSTERS LME
Volumes have also declined on the LME, the world’s oldest and biggest market for industrial metals, but in most cases it has outperformed its U.S. and Chinese rivals.
The LME’s status held on despite a wild spike in nickel prices in March that forced the exchange to suspend activity and cancel billions of dollars in trades, angering many investors and triggering lawsuits.
With confidence undermined, nickel activity has been knocked the most, with LME volumes dropping 17% so far this year, though that is still less than on the ShFE, where they have plummeted 70%.
The dramatic decline is because the Shanghai contract has not established itself as a global benchmark, and there has been a lack of arbitrage opportunities since the LME contract has not been open during key Asian trading times since the March crisis.
LME data shows many participants have abandoned the nickel market, a trend several traders say looks set to continue, leading to even lower volumes and more volatility as more people opt to negotiate prices directly.
Graphic: Nickel Volumes Hit Hardest After March Crisis –
Copper volumes at the 145-year-old LME have dipped just 6% year-to-date, holding up better than ShFE and Comex because the core of its business is based on physical flows including from miners and industrial users, said Marc Bailey, chief executive of broker Sucden Financial in London.
“The LME is very much underpinned by traditional trade flows. Those flows are going to be there, even if they’re going to be less because economic activity is less,” he said.
[ad_2]
Source link


