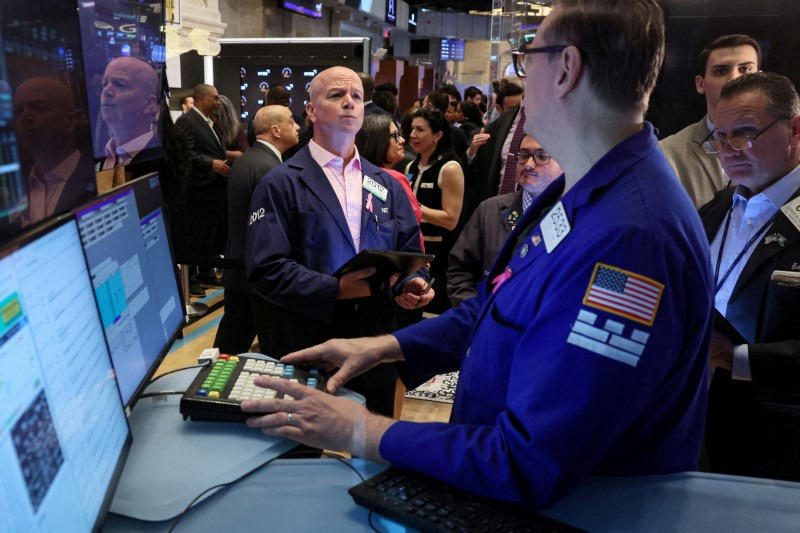
Analysis-Fear fades in US stocks, but history shows quick return to calm unlikely
2024.08.13 01:19
By Saqib Iqbal Ahmed
NEW YORK (Reuters) – Panic appears to have faded following last week’s outbreak of volatility in U.S. stocks, but if history is any guide, markets might remain jittery for months.
Wall Street’s most closely watched gauge of investor anxiety, the Cboe Volatility Index, has rapidly eased after closing at a four-year high last week and stocks came screaming back following the year’s worst tumble. The is up 3% from last week’s lows, while the hovers around 20, far below the Aug. 5 close of 38.57.
Investors pointed to the rapid dissipation of market anxiety as further evidence that last week’s meltdown was fueled by the unwinding of massive leveraged positions, including yen-funded carry trades, rather than longer-term concerns such as global growth.
Even so, turbulent episodes in which the VIX shot higher show markets tend to stay frothy for months after a blowup, arguing against the kind of risk-taking that lifted asset prices in the first part of the year. Indeed, a Reuters analysis showed the VIX has taken an average of 170 sessions to return to its long-term median of 17.6 once it has closed above 35, a level associated with high investor anxiety.
“Once (the VIX) settles into a range, then people will get a little more passive again,” said JJ Kinahan, CEO of IG North America and president of online broker Tastytrade. “But for six months to nine months, it usually shakes people up.”
This month’s U.S. stock market tumult follows a long, placid period in which the S&P 500 rose as much as 19% for the year to a record high in early July. Cracks formed when disappointing earnings from several richly valued technology companies last month sparked a broad-based sell-off and lifted the VIX from its range in the low teens.
More serious ructions followed in late July and early August. The Bank of Japan unexpectedly raised interest rates by 25 basis points, squeezing players in a carry trade fueled by traders borrowing cheaply in Japanese yen to buy higher-yielding assets from U.S. tech stocks to bitcoin.
Meanwhile, investors rushed to price in the chance of a U.S. slowdown following a spate of alarming economic data. The S&P 500 fell as much as 8.5% from July’s records, just missing the 10% threshold commonly considered a correction. The index is still up 12% this year.
Mandy Xu, head of derivatives market intelligence at Cboe Global Markets (NYSE:), said the market’s rapid drop and quick rebound pointed to a positioning-driven unwinding of risk.
“What we saw on Monday (Aug. 5) was really isolated to the equity market and the FX market. We did not see a correspondingly big increase in volatility in the other asset classes, like rate volatility and credit volatility,” she said.
Investors have ample reason to remain jumpy in the months ahead. Many are waiting for U.S. data, including a consumer price report later this week, to show whether the economy is merely downshifting or heading for a more serious slowdown.
Political uncertainty ranging from the US election in November to the prospect of increased Middle East tensions is also keeping investors on their toes.
Nicholas Colas, co-founder of DataTrek Research, is watching whether the VIX can remain below its long-term average of 19.5 to determine whether calm is truly returning to markets.
“Until it (the VIX) drops below 19.5 (the long run average) for a few days at least we need to respect the market’s uncertainty and stay humble about trying to pick bottoms in markets or single stocks,” he said.
CORRECTION WATCH?
The market’s close brush with correction territory may be another worry. In the 28 instances in which the S&P 500 got within 1.5% of confirming a correction, the index went on to do so within 20 cases in an average span of 26 trading sessions, data going back to 1929 showed.
In the eight cases which it did not confirm a correction, however, the index took an average 61 trading sessions to hit a new high.

CPI data due on Aug. 14 and earnings from Walmart (NYSE:) and other retailers this week could be crucial in determining investor sentiment, said Mark Hackett, chief of investment research at Nationwide, in a recent note.
“It wouldn’t be surprising to see potentially overblown reactions to this week’s CPI number, retailer earnings and retail sales from investors given the heightened emotional responses in the market recently.”


