Airbnb Q3 Earnings: Will Travel Industry Recovery Finally Catapult Stock Higher?
2023.10.31 09:30
- Airbnb enjoyed a post-IPO surge but faced a downturn due to COVID-19
- Upcoming Q3 results are crucial for the company after a recent stock decline
- Analysts have optimistic forecasts for Q3, but the stock’s performance will depend on earnings and travel industry’s turnaround
Airbnb (NASDAQ:) made its debut on in December 2020 and experienced a remarkable surge in its stock price shortly before the outbreak of COVID-19. The allure of Airbnb as a growth stock post-IPO triggered increased demand, propelling its share price to nearly $220 within the initial two months of 2021, representing an impressive 50% gain from its opening price of $146.
However, the tide quickly turned in March 2021 when COVID-19 was declared a pandemic, resulting in a substantial downturn for Airbnb as the travel industry ground to a halt. The stock dipped below its IPO opening price, erasing previous gains. Throughout 2021, it maintained a sideways trajectory amidst the ongoing pandemic, but it transitioned into a downward trend in the latter half of 2022.
Airbnb Stock Punished Despite Profit, Revenue Growth
The recovery that kicked off in 2023 extended until July, bolstered by positive developments in the travel industry. Yet, in the last three months, Airbnb’s stock has been on a downward trajectory, instilling a negative outlook as the company approaches the release of its Q3 results scheduled for November 1.
In the previous quarter, announced in August, Airbnb reported earnings per share of $0.98, surpassing expectations by nearly 25%. The quarterly earnings also slightly exceeded the projections set by InvestingPro, amounting to $2.48 billion.
Despite achieving profit growth for five consecutive quarters, investors seem to be penalizing the company for its slowed growth. While the gross profit margin has sustained a year-on-year increase of 75%, the ongoing deceleration in sales, despite an 18% increase, is a matter of significant concern, particularly for a company like Airbnb, which is typically perceived as a growth stock.

Source: InvestingPro
For 2023, after the quarterly results announcement, it is evident that the stock is trading with a bearish bias, indicating that investors are heavily influenced by the company’s financial performance.
This is exemplified by corrections following the financial results released in May and August. However, after the May pullback, the stock surged to a high of $155 by the end of July on speculations of inclusion in the , driven by summer activity in the travel sector.
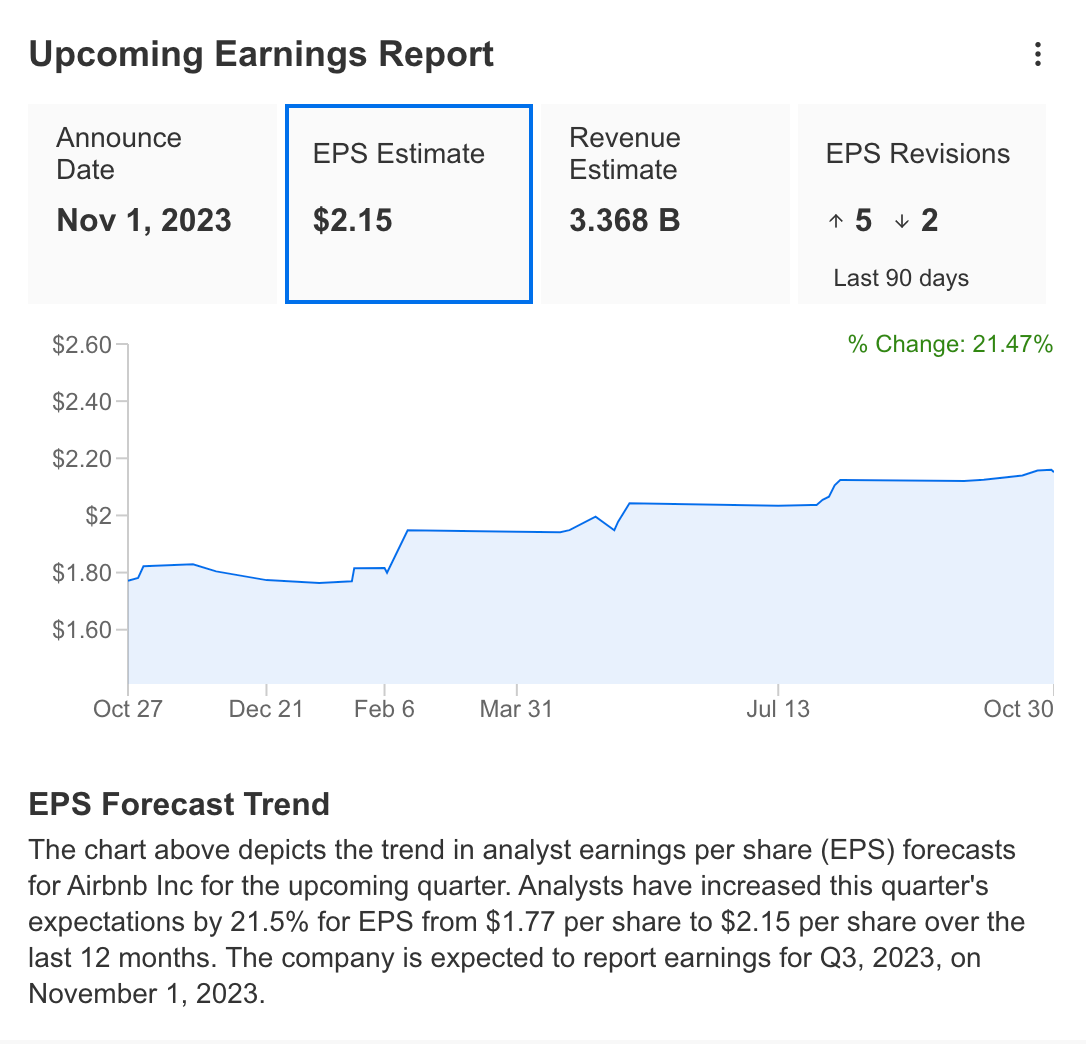
Airbnb’s Q3 earnings report could introduce volatility in the stock price. Analysts are relatively optimistic about the last quarter, with estimates suggesting an earnings per share of $2.15 for Q3.
The consensus view of analysts has increased by 21%, from $1.71 to $2.15, according to the latest update. The revenue forecast for the quarter is $3.36 billion, indicating a 15% year-on-year growth but highlighting the expectation of continued revenue growth deceleration.
Source: InvestingPro
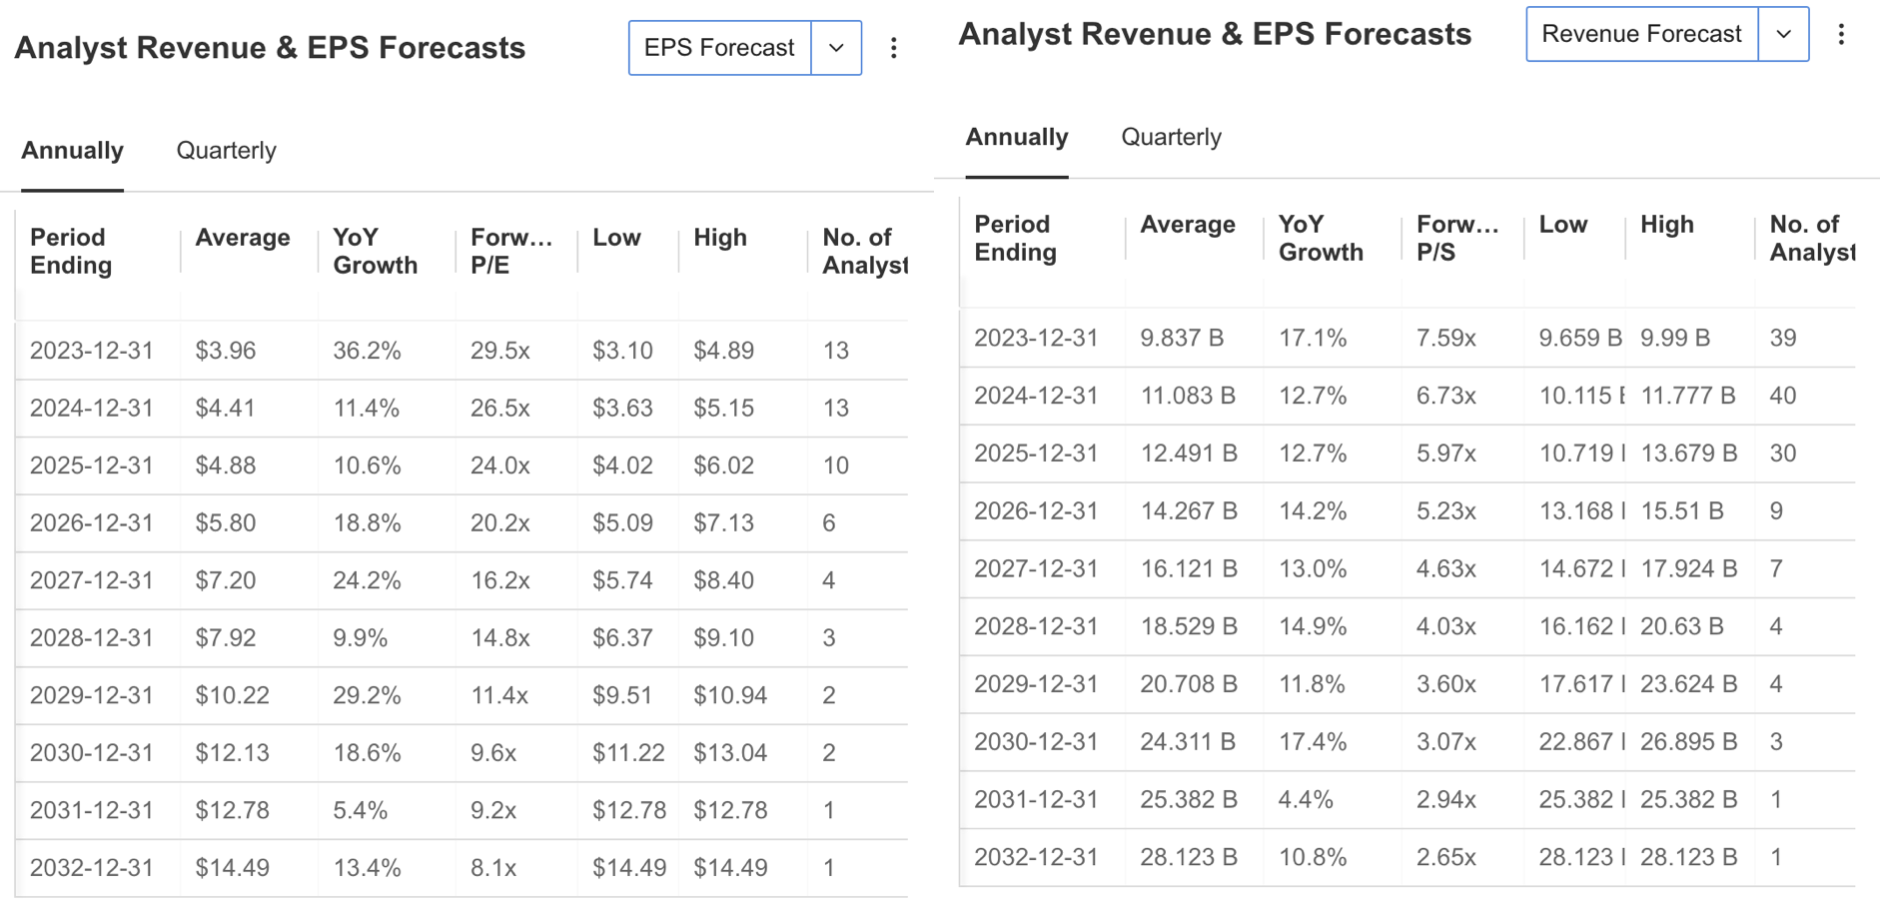
While the slowdown in growth is expected to affect profitability in the forecasts for the coming periods, a decline in EPS is predicted for Q4 and the first quarter of 2024. However, analysts predict that profitability will recover towards the summer months.
While a similar decline is expected in the company’s revenue in the next 6 months, an increase is expected during the periods when the travel industry reaccelerates.
Source: InvestingPro
Airbnb Facing Fierce Competition
In addition to its services in the US, Airbnb, together with its subsidiaries, offers a pioneering intermediary activity that enables hosts to offer accommodation to tourists around the world. However, as this short-term accommodation model has become popular, the number of competitors has increased considerably.
This can be seen as one of the factors that hindered Airbnb’s growth. So much so that even large hotel chains were not indifferent to the growth in this sector and started renting properties similar to the Airbnb model in addition to standard accommodation services.
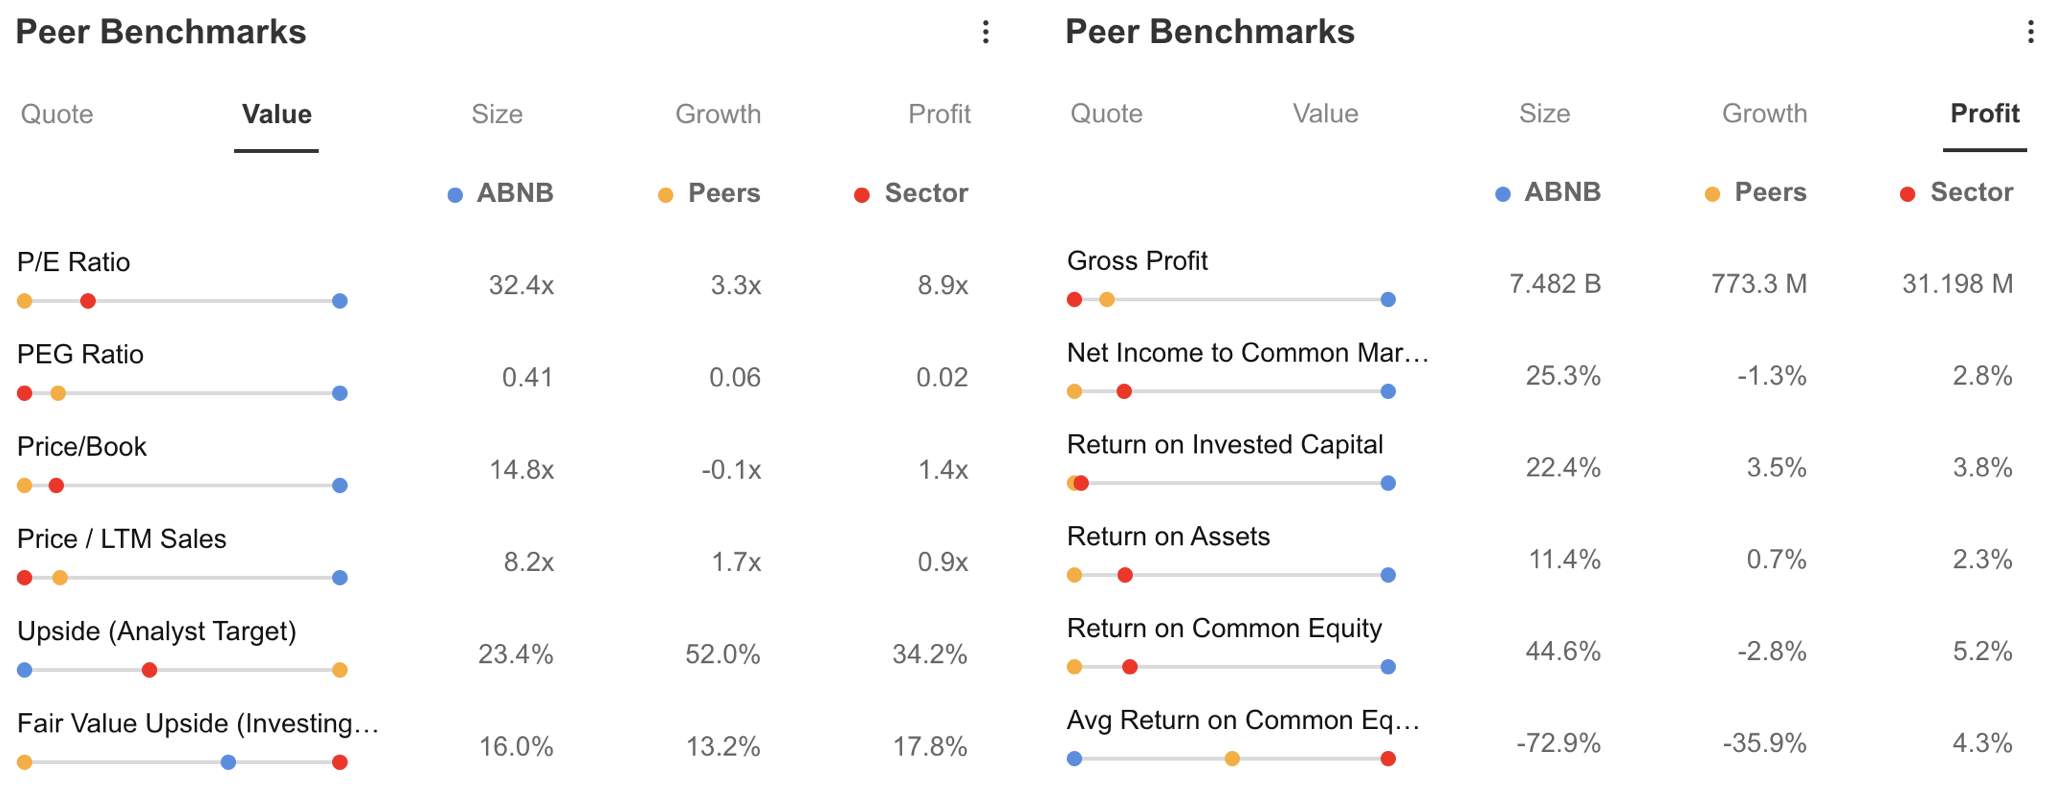
When we compare Airbnb with peer companies on InvestingPro, it can be seen that the company has better performance in almost all key financial items.
While ABNB’s price/income ratio is currently 32.4x, the fact that it remains high compared to the sector and peer companies gives the impression that the stock is overvalued, while the price/book value of 14.8x stands as a ratio that supports this valuation.
Among the other prominent ratios, the return on equity (ROE) for the last 5 years constitutes a negative by showing that the company cannot use its equity efficiently without generating profit. However, the fact that annual profitability items continue to remain above peer companies keeps forward-looking expectations optimistic.
Source: InvestingPro
Through InvestingPro, we can also reach summarized conclusions about a company’s overall outlook. Accordingly, the positive inferences in the InvestingPro summary for Airbnb stand out as follows:
- The company’s cash is above its debt
- Steady rise in earnings per share (EPS)
- Analysts revised their expectations upwards
- High gross margins
- Low F/S ratio compared to short-term profit growth
On the other hand, the fact that Airbnb is a company that does not pay dividends is seen as a negative for long-term investors, while the downward trend of the stock since September remains a question mark. However, given the potential for the stock to move more volatile than the market with a beta of 1.2, it also reveals that there is a possibility of a faster recovery in a possible comeback.
While this inference remains valid in a downward trend, according to the current price movement, Airbnb can be considered a riskier asset in the index.
Source: InvestingPro
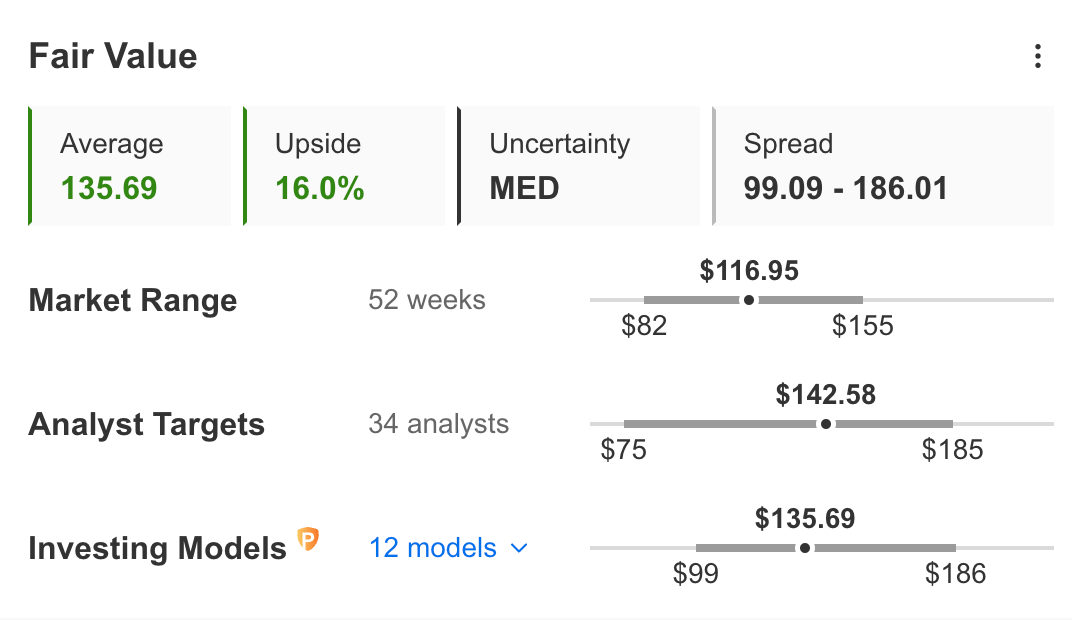
Fair value analysis for ABNB stock, which is trading at $116 today, reveals that the possibility of a recovery is on the table. So much so that according to the 12 InvestingPro model, the fair value was calculated at $ 135. This shows that the stock remains 16% discounted according to this fundamental analysis. The average estimate of 34 analysts points to $ 142, higher than the fair value analysis.
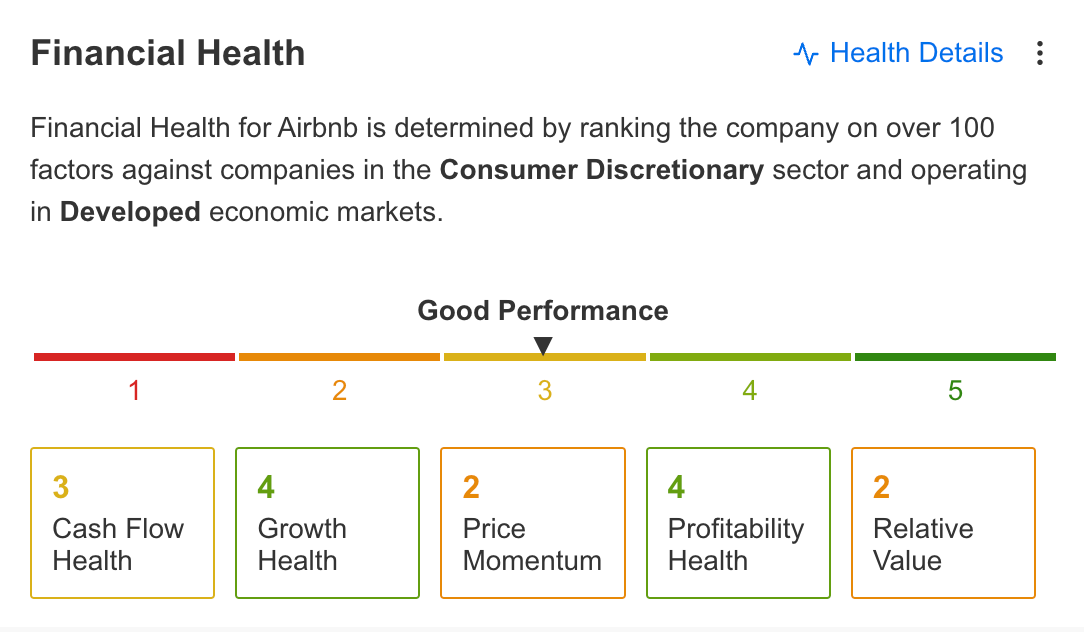
Finally, let’s analyze Airbnb’s financial health according to the InvestingPro summary and try to identify the current support and resistance levels of the share price.
Source: InvestingPro
Airbnb’s current financial health has a good performance with a score of 3 out of 5. The items that raise the average are growth and profitability, while cash flow continues at average value. ABNB’s price momentum is dragging down performance due to the pullback in recent months, while relative value is also among the items that need to be improved.
ABNB Stock: Technical View
Technically, it can be seen that the share of ABNB continues its trend with a higher peak and lower bottom formation pattern in its fluctuating course in 2023. Based on the downtrend originating in November 2021, it is noteworthy that the 2023 trend turned from the ideal correction trend at 160 dollars.
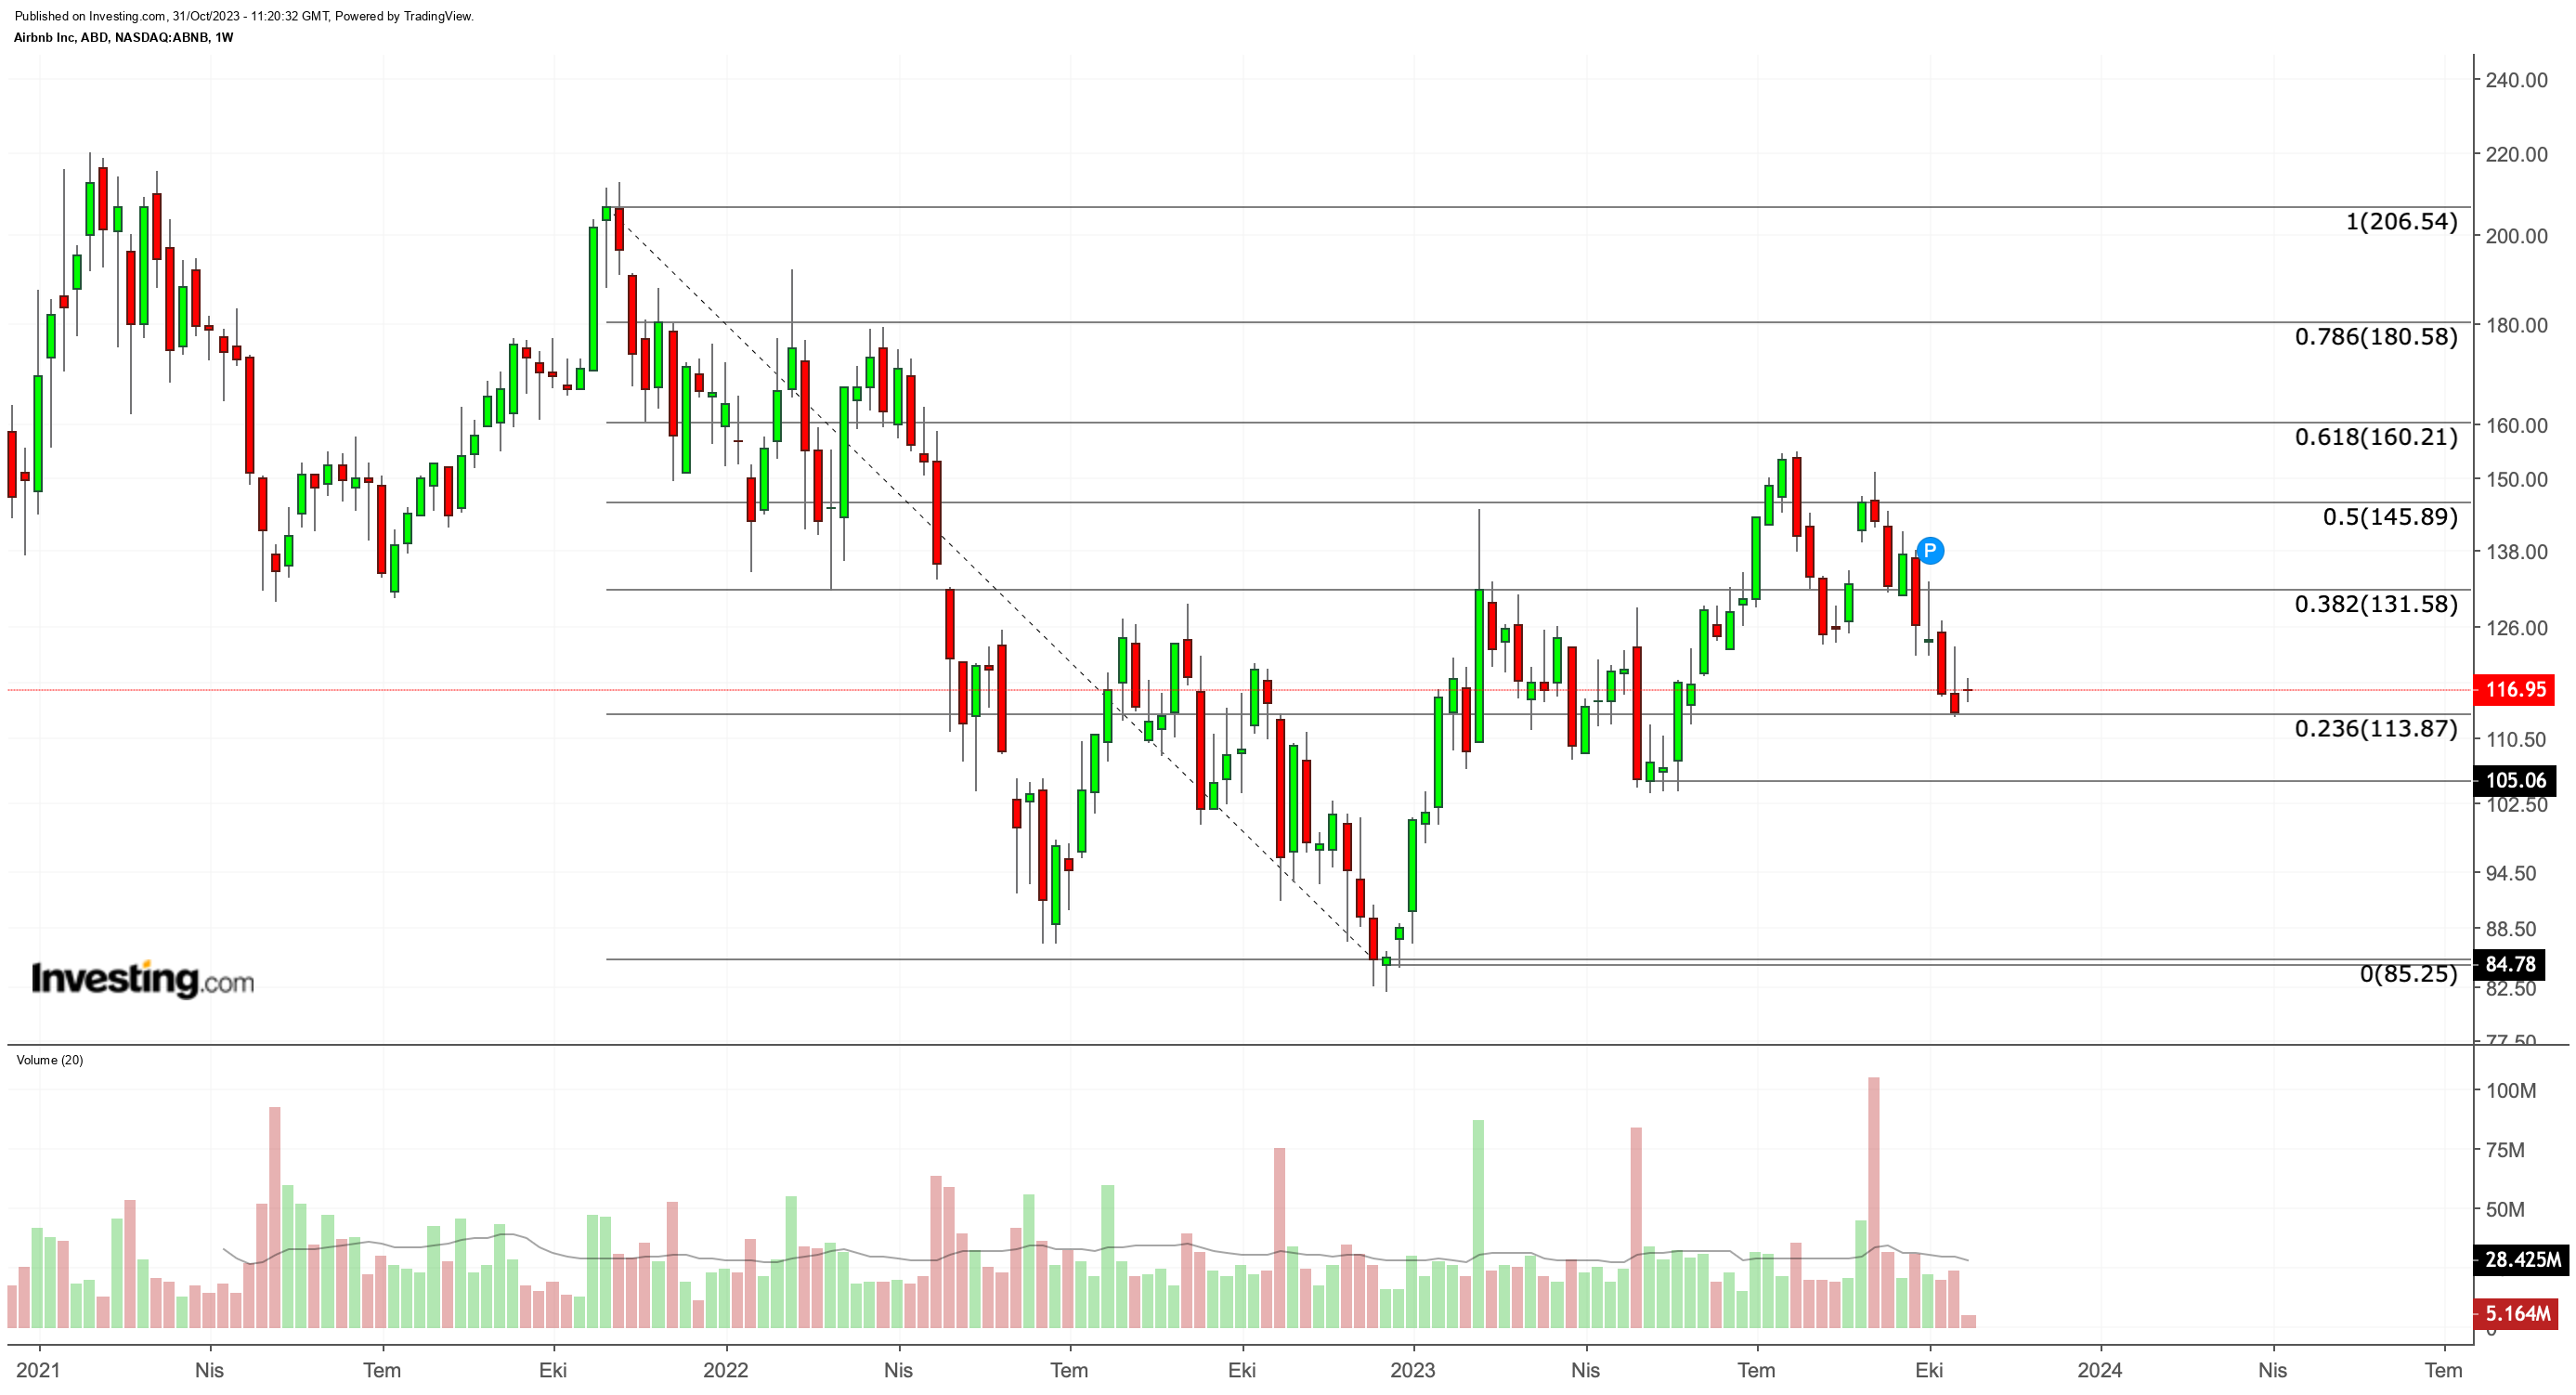
In the current situation, if ABNB manages to maintain the average support of $110 and can see a weekly close above this price level, it may turn its direction upwards in the last quarter of the year as a continuation of the high peak – low bottom pattern.
In this case, we can see that the next local peak of the stock could be in the range of 170 – 180 dollars. On the other hand, if the critical support point of $ 100 below $ 110 is broken, the current pattern will become invalid.
Accordingly, the downward trend is likely to extend towards the $80 band. However, according to the current outlook and expectations for Q3 earnings to be announced, the stock seems more likely to turn its direction upwards.
***

Apple Earnings: What to Expect?
Disclaimer: The author does not own any of these shares. This content, which is prepared for purely educational purposes, cannot be considered as investment advice.


