A Century of Data Show Q4 Stock Gains in Election Years – Will 2024 Follow Suit?
2024.09.30 09:33
- The final quarter of presidential years has historically delivered strong stock market gains.
- Key factors, including fiscal policies and corporate results, often drive this year-end surge.
- Investors should stay alert to macroeconomic events that could disrupt these trends.
- Looking for actionable trade ideas to navigate the current market volatility? Unlock access to InvestingPro’s AI-selected stock winners for under $9 a month!
Stock market seasonality, especially during the final quarter of a U.S. presidential year, has captured the attention of investors for decades.
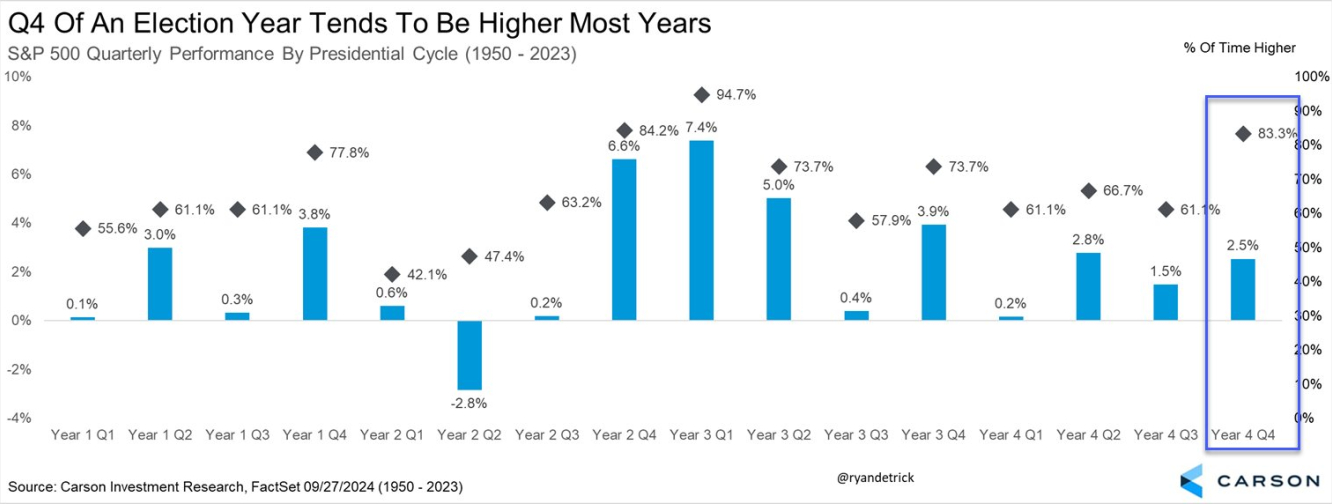
With over a century of historical data showing repeated patterns, year-end rallies are no stranger to seasoned investors, and they become even more pronounced during the fourth year of a U.S. presidential term.
Historically, the last quarter of these years has outperformed others, driven by a combination of economic factors and investor optimism.
So in this piece, we’ll examine why year-end rallies happen and the probability of seeing one materialize in 2024.
Why Do Markets Surge at the End of Presidential Years?
Several factors come together to create this favorable environment for stocks. Outgoing presidents often introduce expansionary fiscal policies, aiming to solidify a positive legacy.
Investors, buoyed by pre-election optimism, anticipate economic improvements from new leadership. Additionally, corporations push to close the fiscal year on a strong note, boosting market performance.
Looking at the (DJIA) since 1900, the data speaks for itself:
- Average Q4 performance: +3.8%
- Frequency of positive quarters: 72%
- Best performance: +21.3% in 1928
- Worst performance: -22.7% in 2008
Nearly three-quarters of these quarters posted gains, with some, like this year, even bucking historical trends. September’s expected seasonal decline did not materialize, as the posted new all-time highs.
This could push the probability of a positive Q4 to over 90%.
Key Factors Driving the Market’s Final Quarter Surge
Three key drivers have historically boosted stock market performance in the final quarter of presidential years:
- Expansionary fiscal policies: Outgoing administrations often introduce growth-friendly measures to leave a positive economic legacy.
- Pre-election optimism: Investors speculate on favorable policies from new leadership, which fuels confidence.
- Corporate year-end results: Companies aim to close their fiscal years with solid performance, contributing to stock market gains.
While the fourth quarter of the presidential year has been overwhelmingly positive, history also offers cautionary tales.
In 1932, during the Great Depression, the market shrank by 8.5%. More recently, the 2008 global financial crisis led to a staggering 22.7% drop.
These exceptions remind us that external factors, like global economic crises, can override typical seasonal trends.
Bottom Line: Will 2024 Follow Suit?
History strongly suggests that the final quarter of a presidential year tends to be bullish. However, investors should remain cautious. While these trends offer valuable insights, unforeseen macroeconomic events can quickly shift the market’s trajectory.

A strong recovery in China or unexpected geopolitical tensions, for example, could easily sway market performance.
Incorporating this historical data into a broader strategy can give investors a critical edge, but success lies in staying attuned to the ever-evolving global market landscape.
***
Disclaimer: This article is written for informational purposes only. It is not intended to encourage the purchase of assets in any way, nor does it constitute a solicitation, offer, recommendation or suggestion to invest. I would like to remind you that all assets are evaluated from multiple perspectives and are highly risky, so any investment decision and the associated risk is at the investor’s own risk. We also do not provide any investment advisory services.


