4 Tech Stocks With Upside Potential and Dividend Yields Beating S&P 500
2023.09.27 08:04
- While it isn’t common knowledge, some tech stocks offer great dividend yields
- In fact, they far exceed the S&P 500’s 1.3% yield
- Using insights from InvestingPro, let’s delve deep into 4 such stocks
There’s a common belief that technology companies typically don’t pay substantial dividends, and if they do, the yields are often low or just for the sake of it. However, a closer look reveals that several technology companies offer dividends with notably attractive annual yields, especially when compared to the ‘s modest +1.3% yield.
In fact, as of the second quarter of 2023, dividends from technology stocks have delivered a yield of nearly 15%, which is in close proximity to the financial sector’s yield, slightly exceeding 15%.
Let’s explore some of these tech companies using the InvestingPro tool, which provides valuable data and insights.
1. IBM
International Business Machines (NYSE:), headquartered in Armonk, New York, is a company that specializes in manufacturing and marketing computer hardware and software. It also offers infrastructure, internet hosting, and consulting services.
IBM has a rich history, with its origins dating back to 1911 when it was founded as the Computing Tabulated Recording Corporation, the result of a merger involving four companies. It officially adopted the name IBM in 1924. One notable aspect of IBM is its dividend, which boasts an impressive annual yield of +4.60%.
On July 29, IBM reported its latest and the earnings per share (EPS) exceeded forecasts by a substantial +8.9%. Looking ahead, IBM is set to release its next earnings report on October 25, and market expectations are optimistic, anticipating a real revenue increase of +5.04%. For the current fiscal year, actual revenue forecasts point to a growth of +2.9%, and for 2024, an even more promising growth rate of +4% is expected.
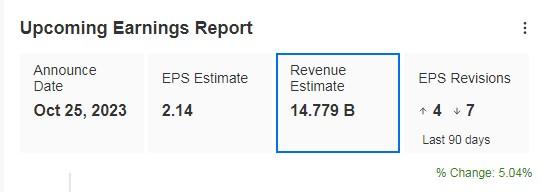
IBM upcoming Earnings
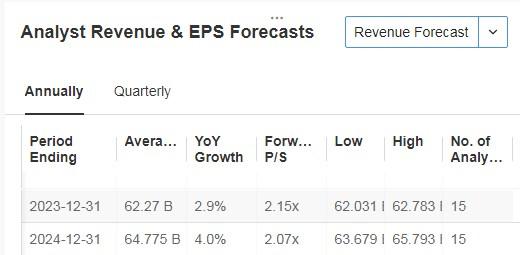
IBM Revenue and EPS Forecast
Source: InvestingPro
InvestingPro models give it a potential at $160.59, while RBC Capital Markets increased it to $188.

IBM Target Price – InvestingPro
Source: InvestingPro
In the last 12 months, its shares are up +17% and in the last 3 months, they’re up +9%.
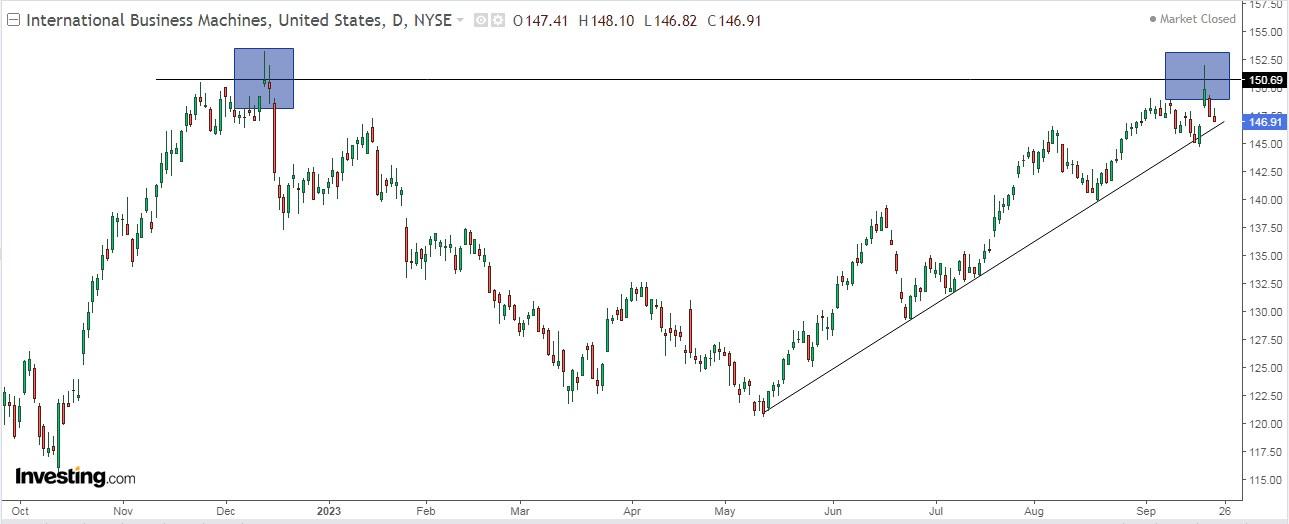
It reached its resistance last week and so far hasn’t been able to overcome it.
2. HP
HP (NYSE:), headquartered in Palo Alto, California, came into existence following the split of Hewlett-Packard into two separate entities in November 2015. HP stands out as the world’s leading company in printer sales and is a significant player in the global market for computers and laptops.
An interesting development for HP is the recent announcement of the appointment of David Meline as a new member of its board of directors. David Meline, the former Chief Financial Officer (CFO) of Moderna (NASDAQ:), is set to officially join the board on November 1, 2023.
HP also boasts a noteworthy dividend yield of +3.92%.

HP Dividend Data
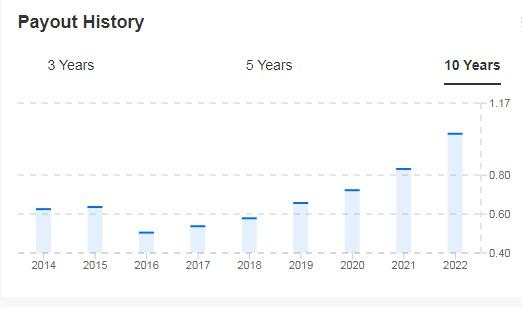
HP Payout History
Source: InvestingPro
HP reported its financial on August 29, which showed some weaknesses. While the earnings per share (EPS) managed to surpass expectations by a slight margin, the actual revenue fell short, recording a -1.5% decrease.
The upcoming results are scheduled for release on November 21. As for the outlook for 2023, expectations are not particularly optimistic. However, things seem to take a positive turn in 2024, with the market anticipating a +4.5% increase in EPS and a +2.6% growth in actual revenues.
In terms of stock performance, over the past 12 months, HP’s stock has increased by +3%. However, it’s worth noting that they have experienced declines in recent times, about -26% in the last 3 months. Nevertheless, there’s a positive outlook for the stock as it could bounce back, with potential seen at $30.22, while InvestingPro models project an even higher potential at $34.11.

HP Price Targets
Source: InvestingPro
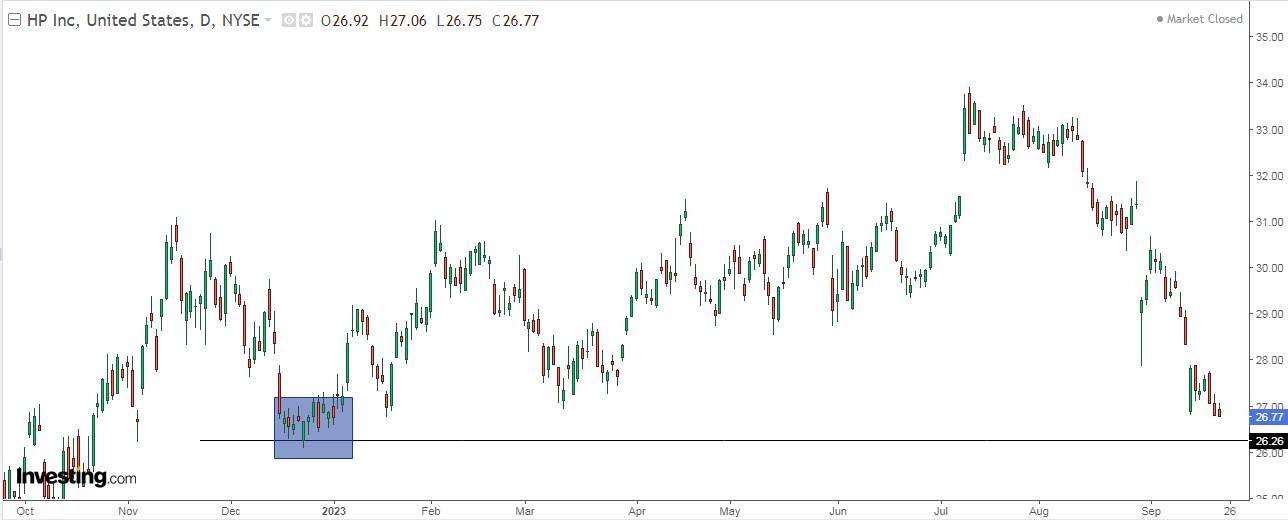
In mid-July it began to fall and is approaching one of its supports.
3. Corning
Corning (NYSE:) specializes in the manufacturing of glass, ceramics, and related materials, primarily designed for industrial and scientific applications. The company originally operated under the name Corning Glass Works until 1989 when it adopted its current name, Corning Incorporated. Corning Incorporated has a long history, with its founding dating back to the year 1851.
Notably, Corning Incorporated offers an appealing dividend yield of +3.59%.
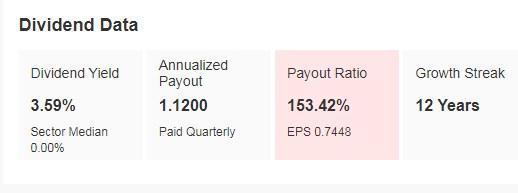
Corning Incorporated Dividend Data
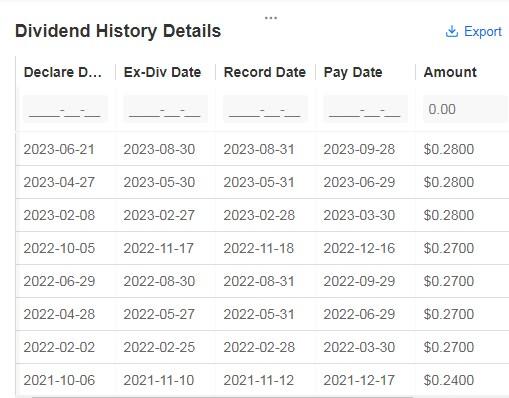
Corning Incorporated Dividend History
Source: InvestingPro
July 25 showed slightly better-than-expected actual revenues (+0.1%) but slightly lower EPS (-0.3%). It reports its next results on October 24. The market expects actual revenues for 2023 to fall by -5.5%, in contrast for 2024 it expects an increase of +7% and for 2025 +6%.
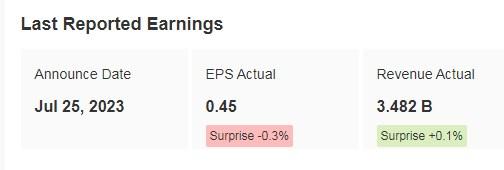
Corning Incorporated Latest Earnings
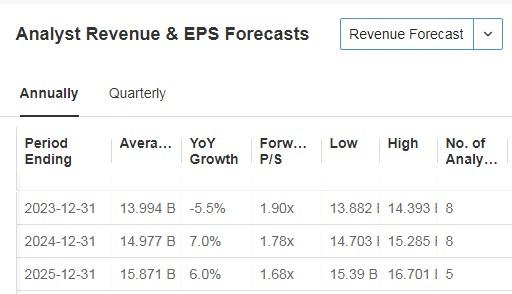
Corning Incorporated EPS and Revenue Targets
Source: InvestingPro
The company has seen a drop in demand from its consumer electronics customers as smartphone makers attempt to clean up an inventory buildup caused by high inflation and rising interest rates.
The company has taken aggressive steps this year to cut costs and offset the slump in its core markets, which, combined with earlier price increases, has helped it continue to expand its gross margin.
With data updated at the close of the week, its shares are up +0.77% over the last 12 months but down -11% over the last 3 months. The market and InvestingPro models agree on the potential it could have. In the first case at $38.25, and in the second case at $38.90.

Corning Incorporated Price Targets
Source: InvestingPro
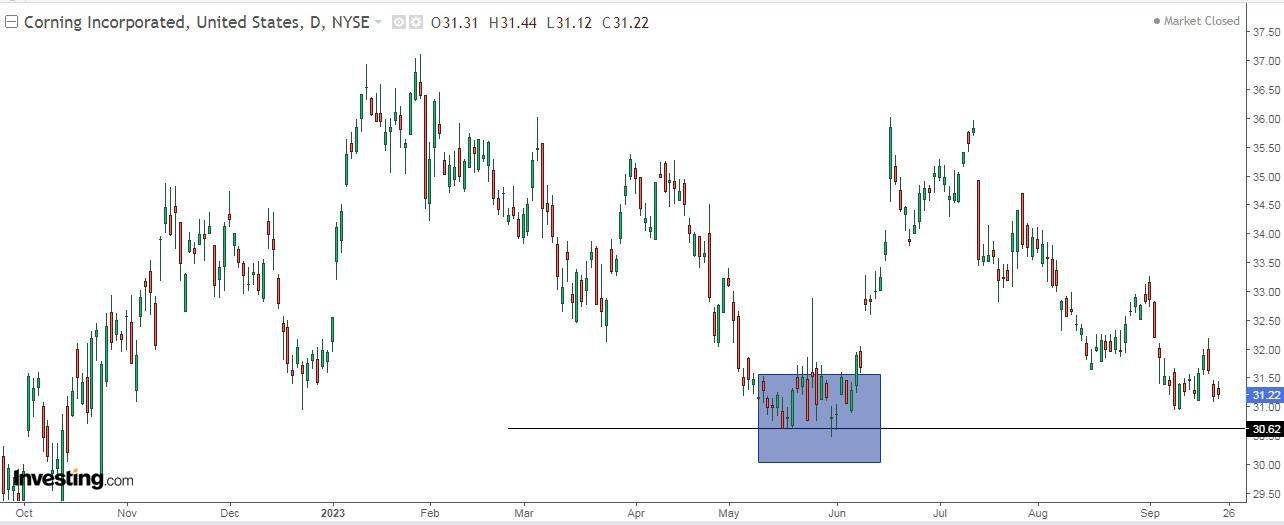 Corning Incorporated Stock Chart
It has been falling since mid-July and is very close to key support.
4. Juniper Networks
Juniper Networks (NYSE:), established in 1996, is a multinational corporation specializing in networking and security systems. The company’s headquarters are situated in Sunnyvale, California. Notably, Juniper Networks is a key competitor to Cisco (NASDAQ:), particularly in the European market, where it competes directly with Cisco in the field of networking and security solutions.
Juniper Networks offers an attractive dividend yield of +3.15%.

Juniper Networks Dividend Data
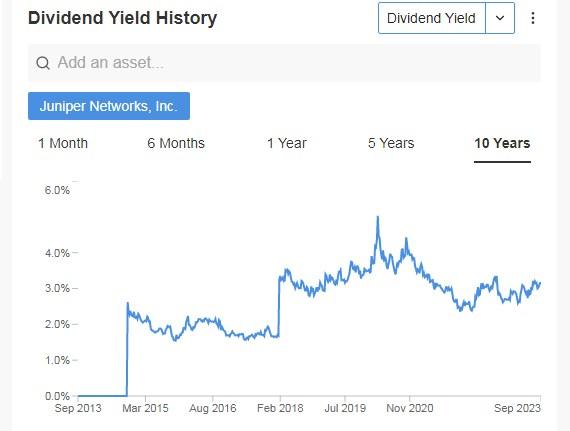
Juniper Networks Dividend Yield History
Source: InvestingPro
Good were presented on July 27 with EPS up +6.9% and actual revenue up +1.1%. The next earnings will be presented on October 26. The market expects 2023 EPS growth of +13.9% and 2024 EPS growth of +6%.
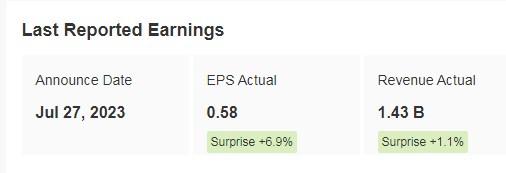
Juniper Networks Previous Earnings
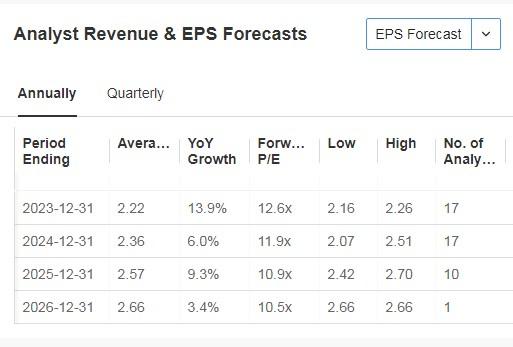
Juniper Networks Revenue and EPS Forecasts
Source: InvestingPro
With data updated at the end of the week, its shares are up +5% in the last 12 months, while in the last 3 months, they are down -5.5%. The market sees potential at $32.69, while InvestingPro models see it at $34.78.

Juniper Networks Price Target
Source: InvestingPro
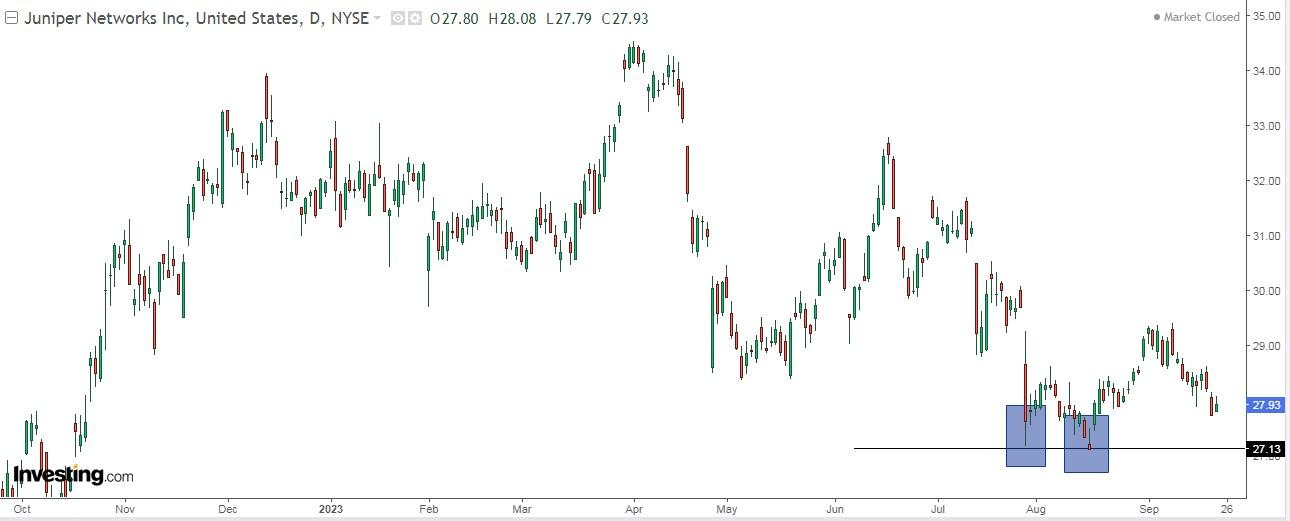 Juniper Networks Stock Chart
The stock has been in a bearish phase since April and is very close to its support.
***

Find All the Info you Need on InvestingPro!
Disclaimer: This article is written for informational purposes only; it does not constitute a solicitation, offer, advice, counsel or recommendation to invest as such it is not intended to incentivize the purchase of assets in any way. As a reminder, any type of assets, is evaluated from multiple points of view and is highly risky and therefore, any investment decision and the associated risk remains with the investor. The author does not own the stocks mentioned in the analysis.


