3 Reasons Why the Stock Market Rally Could Extend Through Year-End
2024.10.14 08:19
- Stocks hit record highs last week, fueling investor optimism as earnings reports rolled in.
- Amid better-than-expected macroeconomic data and with rate cuts on the horizon, the market could sustain its momentum.
- Historical trends suggest that recent gains may signal further growth as we approach year-end.
- Looking for actionable trade ideas to navigate the current market volatility? Unlock access to InvestingPro’s AI-selected stock winners for under $9 a month!
Stocks closed last week at record highs, reflecting a wave of optimism among investors.
As they eagerly digested quarterly earnings releases, discussions around the cut at its November meeting took center stage, with the probabilities for a 25-point cut at 84% for now.
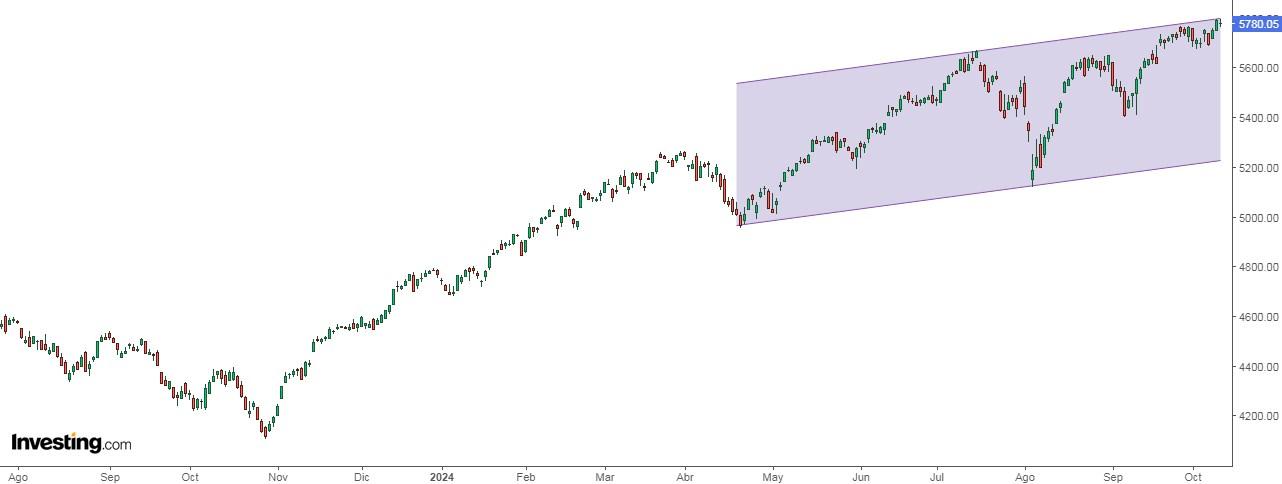
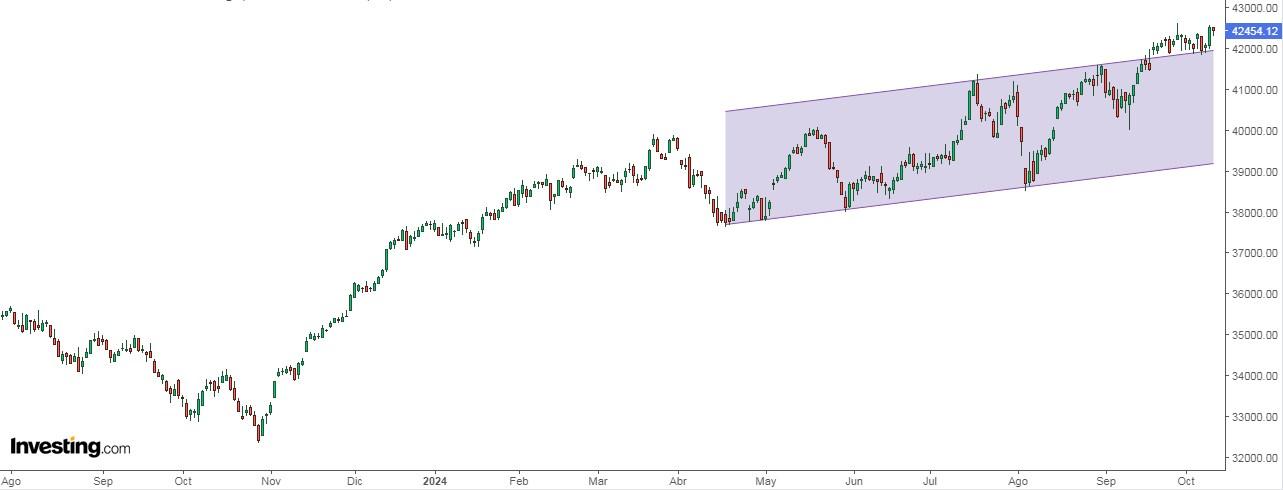
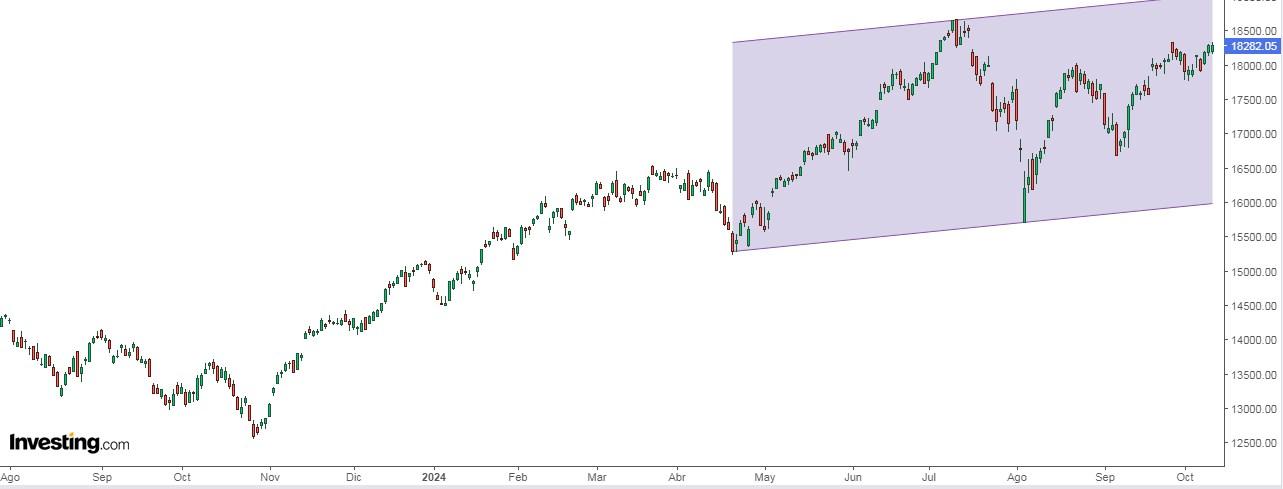
This past week saw the , , and all climb more than 1%, with both the Dow and S&P 500 achieving all-time highs on Friday.
The positive momentum raises an intriguing question: can this rally sustain its energy as we head into year-end?
With interest rate cuts on the horizon, strong macroeconomic data, and robust corporate earnings expectations, the groundwork for continued growth is solid.
Let’s explore three specific reasons why the market rally could not only persist but potentially accelerate as we approach the close of the year.
1. Record-Highs in October Could Signal More Gains Ahead
The S&P 500’s recent all-time highs in October are historically a good omen. Since 1950, when the index hits a record in October, it tends to climb another 5% on average through the end of the year.

Out of 20 similar instances, the market continued to rise in 18 of them, with notable gains like 2021’s 10.6% surge. Only twice—in 1983 and 2007—did the index fail to deliver a fourth-quarter rally.
2. Strong Performance Early in the Year Boosts Year-End Odds
The S&P 500 has already gained 35.2% over the last 12 months, one of its best streaks in history. When the index surges more than 20% in the first nine months, it tends to finish the year even stronger.
This scenario has played out nine times before (excluding 2024), with only two exceptions—1967 and 1987—where the market didn’t keep rising.
3. Dow Jones and Nasdaq Also Point to a Strong Finish
The Dow Jones is up more than 10% year-to-date, a setup that’s led to further gains in 22 out of 29 cases since 1950. Historically, the Dow adds about 5% in the final quarter under these circumstances.

Similarly, the Nasdaq Composite’s 20% jump so far this year mirrors past rallies where the index tacked on another 6.6% in the last three months, with only a handful of exceptions like the crash years of 1987 and 1997.

With all major indices showing strong trends and history on the bulls’ side, the stock market looks poised to keep climbing into the close of 2024. Of course, it is crucial to keep in mind that past performance is never a guarantee of future results.
***
Disclaimer: This article is written for informational purposes only; it does not constitute a solicitation, offer, advice, counsel or recommendation to invest as such it is not intended to incentivize the purchase of assets in any way. I would like to remind you that any type of asset, is evaluated from multiple perspectives and is highly risky and therefore, any investment decision and the associated risk remains with the investor.


