3 Dividend Stocks to Watch as Earnings Season Heats Up
2023.07.27 08:33
- Tomorrow, long-standing dividend companies will announce their earnings.
- Ahead of the earnings, Colgate-Palmolive stock is undergoing a consolidation
- Meanwhile, Proctor & Gamble stock faces resistance, and AstraZeneca stock has decent upside potential
As earnings season begins to wind down for the growth giants, it is time for investors to turn some of their attention back to the dividend-paying value giants of the market, with Colgate-Palmolive (NYSE:), AstraZeneca (NASDAQ:), and Procter & Gamble (NYSE:) all poised to deliver important reports over the next few market sessions.
Ahead of the report, Colgate-Palmolive’s stock has been undergoing consolidation for over two months, indicating anticipation of a potential breakout following tomorrow’s earnings.
Meanwhile, AstraZeneca’s stock has faced challenges driven by negative sentiment surrounding clinical trial results. Investors will be closely watching the forthcoming earnings report for potential insights regarding this.
Lastly, Procter & Gamble continues to maintain its reputation as a stalwart defensive company, maintaining stability over the years and appealing to investors seeking a defensive addition to their portfolio.
Let’s take a closer look at each of these companies individually to assess their financial performance going into earnings.
1. Colgate-Palmolive: Time to Break Out of Consolidation?
Colgate-Palmolive, a well-known consumer staples company, is gearing up to unveil its highly anticipated third-quarter 2023 results this Friday. Market forecasts suggest that the company’s earnings per share are expected to reach $0.75, accompanied by impressive revenues of $4.696 billion.
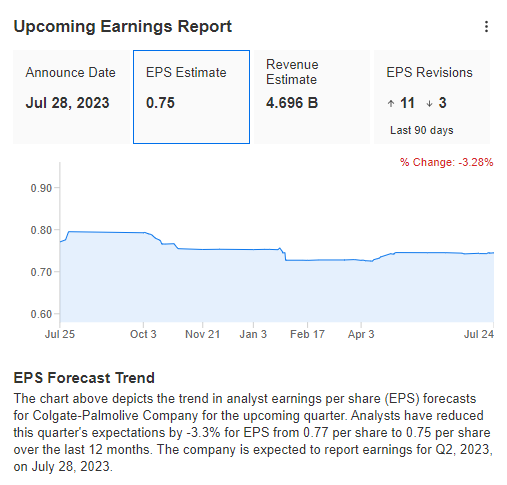
CL Upcoming Earnings
Source: InvestingPro
For over two months, the stock has remained in a local consolidation phase, creating a situation where better-than-forecast readings in tomorrow’s report could potentially trigger a breakout in an upward direction.
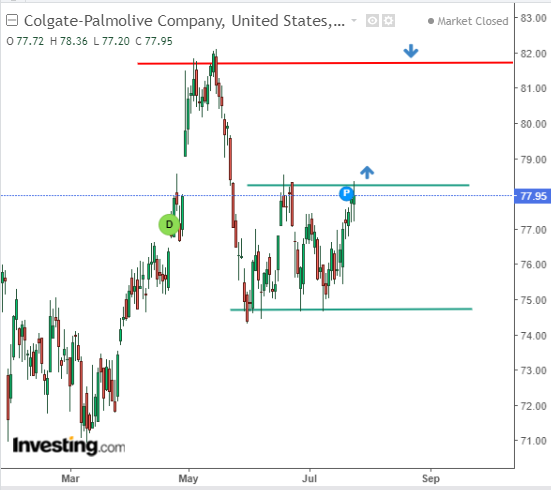
CL Price Chart
Looking at the bigger picture, the stock is still following a long-term uptrend, albeit within a broader correction pattern. This suggests that despite the short-term consolidation, the overall trajectory of the stock remains positive, and there is potential for a rally.
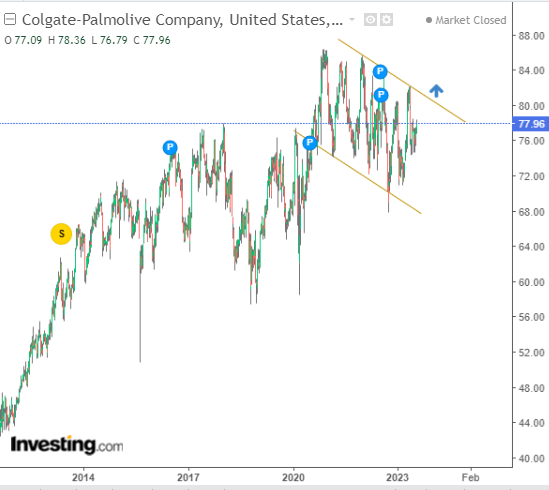
CL Price Chart
Breaking the upper limit of the long-term flag formation, in this case, will be crucial for the continuation of the uptrend.
2. AstraZeneca’s Stock Has Continued to Climb
Earlier this month, AstraZeneca released a report on the results of a clinical trial for a new lung cancer drug developed in collaboration with Japanese company Daiichi Sankyo (TYO:). However, the findings disappointed investors as they didn’t confirm a clinically significant outcome.
The drug was also expected to match or surpass the success of its predecessor, Enheret, which raised hopes among investors.
Nevertheless, AstraZeneca remains determined to continue the study and plans to submit a comprehensive report to regulatory authorities for review. Despite the initial setback, the company holds optimism for the drug’s future potential.
Regarding earnings per share, the projections have remained unchanged since the Q1 , with the current reading at $0.97 per share, compared to the previous figure of $0.96. Interestingly, the market has seen buyers making up some of the losses, suggesting a potential continuation of the upward trend.
In fact, fair value assessments show nearly 20% upside potential for the stock, indicating a positive outlook. Despite the recent challenges in the clinical trial, investors may find reasons to remain hopeful about the company’s prospects going forward.
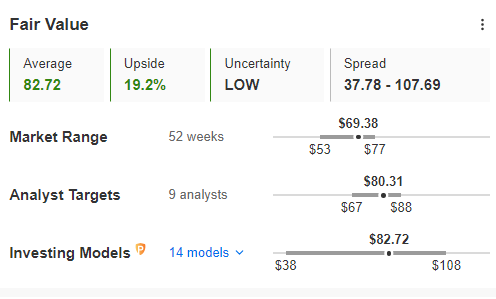
AZN Fair Value
Source: InvestingPro
3. Procter & Gamble Stock Faces Resistance
Procter & Gamble is a well-known and highly regarded consumer staples company. Renowned for its strong brand presence in the market, it serves as a reliable choice for a defensive portfolio position.
One notable aspect of Procter & Gamble is its impressive dividend payment history, which stands as the longest among the three companies analyzed. Over the past decade, the company has consistently increased its dividends, further adding to its appeal to income-seeking investors.
With its solid reputation, stable performance, and consistent dividend growth, Procter & Gamble continues to be an attractive option for investors looking for a reliable and defensive addition to their portfolio.
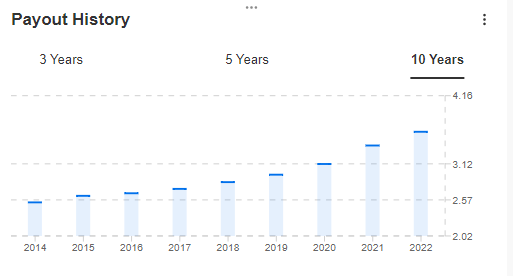
PG Dividend Payout History
Source: InvestingPro
Tomorrow’s earnings are likely to show a continuation of the recent trend where earnings per share deviations have been relatively small. Investors will be paying close attention to any guidance or forecasts provided by the company for future reporting periods, as these can have a significant impact on market sentiment.
The current base scenario suggests that the upward trend will continue, and if the stock manages to break through the $158 per share level, it could open the path for an attempt to reach the historical highs set at the beginning of last year.
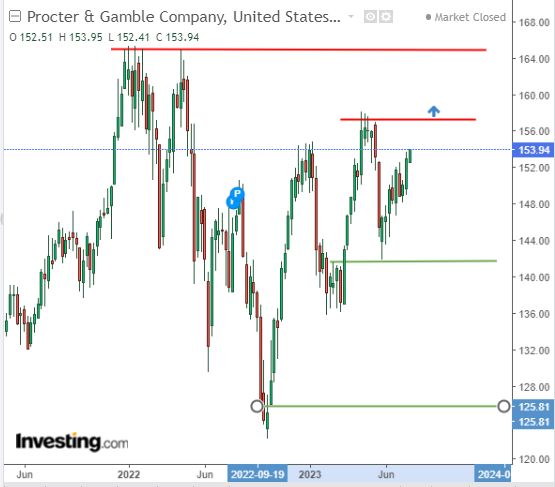
PG Price Chart
***

Disclaimer: This article is written for informational purposes only; it does not constitute a solicitation, offer, advice, counsel, or recommendation to invest as such it is not intended to incentivize the purchase of assets in any way. As a reminder, any type of asset is evaluated from multiple points of view and is highly risky and, therefore, any investment decision and the associated risk remains with the investor. The author owns the stocks mentioned in the analysis.


