10 Value Stocks Ready to Outshine the Market in the Coming Months
2024.09.06 11:17
As September unfolds, it’s crucial to note that this month often ranks as one of the most challenging for equities historically.
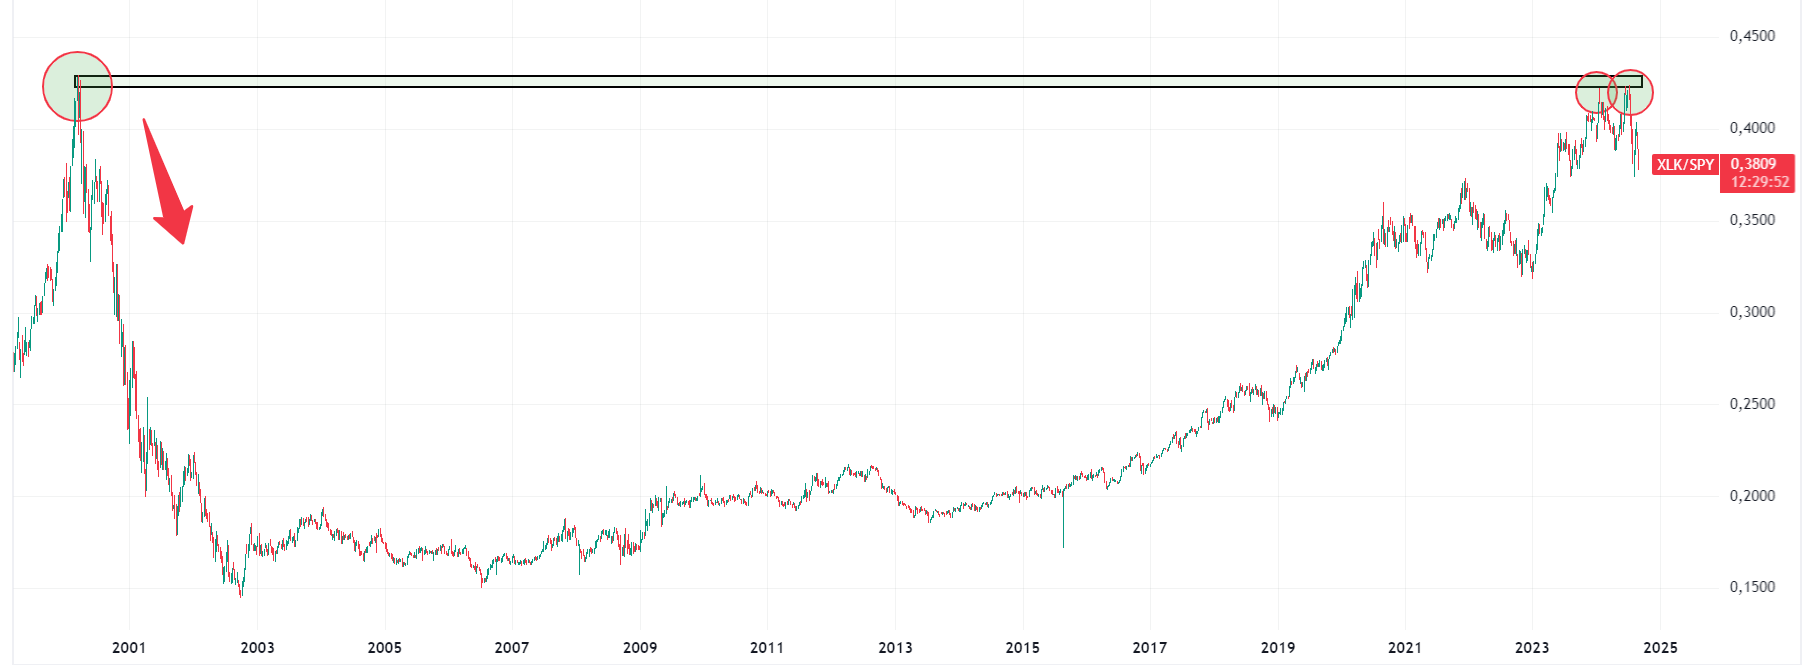
One key ratio I’m monitoring right now is the performance of technology stocks (NYSE:) relative to the , which has recently climbed back to levels seen during the dot-com bubble.

Why does this matter? Technology stocks make up over 30% of the S&P 500, and for the first time in over two decades, this ratio has hit the March 2000 highs, just before the tech crash.
Currently, the market is respecting these levels, with technology stocks lagging and falling to new 52-week lows compared to the S&P 500.
Could Value Stocks Be the Next to Shine?
Since June, the bullish market has been driven by large-cap technology stocks, which led to a swift market expansion and a shift in leadership. Could value stocks be the next to shine?
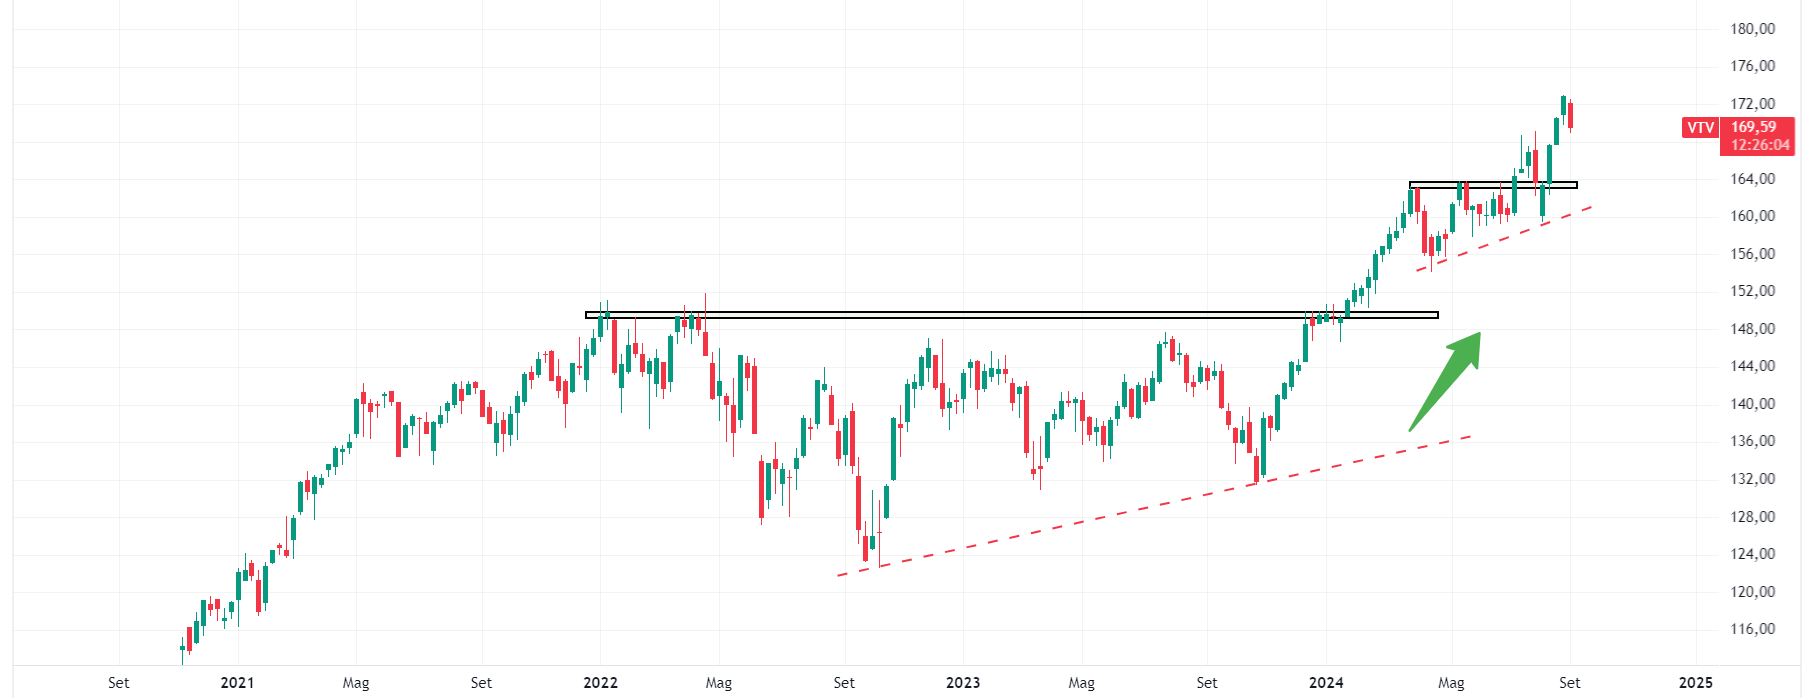
Indeed, the market’s expansion has spurred momentum in value stocks. The Vanguard Value Index Fund ETF (NYSE:), for instance, has reached new all-time highs this year, with a +15.6% return (excluding a +2.29% dividend yield).

This Value ETF focuses on large-cap stocks, and its top 10 holdings include:
- Broadcom (NASDAQ:)
- Berkshire Hathaway (NYSE:)
- JPMorgan Chase & Co (NYSE:)
- Exxon Mobil Corp (NYSE:)
- UnitedHealth Group (NYSE:)
- Johnson & Johnson (NYSE:)
- Procter & Gamble Company (NYSE:)
- Home Depot (NYSE:)
- AbbVie (NYSE:)
- Walmart (NYSE:)
We’ve added the 10 value stocks that could push this ETF to new highs to our Pro Watchlist.

Analyzing these stocks using InvestingPro’s tools, Broadcom stands out. Despite a 29.6% expected rebound, InvestingPro’s Fair Value suggests the stock is currently fairly valued.

Broadcom is nearing previous highs, and while uncertainty remains short-term, its Health Score—an indicator of financial health—reflects a strong performance, earning a 4 out of 5.
Analysts forecast a 43.4% sales growth for Broadcom this year, outpacing competitors. This anticipated growth could signal increased profitability and a higher share price, which is a positive sign for investors.


Moreover, Broadcom has delivered a remarkable 511.1% return over the past five years, outperforming its peers.

This long-term uptrend highlights effective business strategies and robust shareholder value, affirming the stock’s positive trajectory.

Bottom Line
In summary, September’s historically tough market environment highlights the renewed interest in technology stocks reaching past highs.
As technology yields to value stocks, the Value ETF’s strong performance, particularly with leading companies like Broadcom, suggests potential for continued gains.
Investors should watch for emerging opportunities in value stocks as they might drive the next wave of market growth.
***
Whether you’re a novice investor or a seasoned trader, leveraging InvestingPro can unlock a world of investment opportunities while minimizing risks amid the challenging market backdrop.
Subscribe now and unlock access to several market-beating features, including:
- InvestingPro Fair Value: Instantly find out if a stock is underpriced or overvalued.
- AI ProPicks: AI-selected stock winners with proven track record.
- Advanced Stock Screener: Search for the best stocks based on hundreds of selected filters, and criteria.
- Top Ideas: See what stocks billionaire investors such as Warren Buffett, Michael Burry, and George Soros are buying.

Disclaimer: This article is written for informational purposes only; it does not constitute a solicitation, offer, advice, counsel or recommendation to invest as such it is not intended to incentivize the purchase of assets in any way. I would like to remind you that any type of asset, is evaluated from multiple perspectives and is highly risky and therefore, any investment decision and the associated risk remains with the investor.


